at Radar: “President Obama’s well-publicized national open data policy (pdf) makes it clear that government data is a valuable public resource for which the government should be making efforts to maximize access and use. This policy was based on lessons from previous government open data success stories, such as weather data and GPS, which form the basis for countless commercial services that we take for granted today and that deliver enormous value to society. (You can see an impressive list of companies reliant on open government data via GovLab’s Open Data 500 project.)
Based on this open data policy, I’ve been encouraging entrepreneurs to invest their time and ingenuity to explore entrepreneurial opportunities based on government data. I’ve even invested (through O’Reilly AlphaTech Ventures) in one such start-up, Hipcamp, which provides user-friendly interfaces to making reservations at national and state parks.
A better system is sorely needed. The current reservation system, managed by the Active Network / Reserve America is clunky and almost unusable. Hipcamp changes all that, making it a breeze to reserve camping spots.
But now this is under threat. Active Network / Reserve America’s 10-year contract is up for renewal, and the Department of the Interior had promised an RFP for a new contract that conformed with the open data mandate. Ideally, that RFP would require an API so that independent companies could provide alternate interfaces, just like travel sites provide booking interfaces for air travel, hotels, and more. That explosion of consumer convenience should be happening for customers of our nation’s parks as well, don’t you think?…”
Tackling Wicked Government Problems
Book by Jackson Nickerson and Ronald Sanders: “How can government leaders build, sustain, and leverage the cross-organizational collaborative networks needed to tackle the complex interagency and intergovernmental challenges they increasingly face? Tackling Wicked Government Problems: A Practical Guide for Developing Enterprise Leaders draws on the experiences of high-level government leaders to describe and comprehensively articulate the complicated, ill-structured difficulties they face—often referred to as “wicked problems”—in leading across organizational boundaries and offers the best strategies for addressing them.
Tackling Wicked Government Problems explores how enterprise leaders use networks of trusted, collaborative relationships to respond and lead solutions to problems that span agencies. It also offers several approaches for translating social network theory into practical approaches for these leaders to build and leverage boundary-spanning collaborative networks and achieve real mission results.
Finally, past and present government executives offer strategies for systematically developing enterprise leaders. Taken together, these essays provide a way forward for a new cadre of officials better equipped to tackle government’s twenty-first-century wicked challenges”
Chicago uses big data to save itself from urban ills
Aviva Rutkin in the New Scientist: “THIS year in Chicago, some kids will get lead poisoning from the paint or pipes in their homes. Some restaurants will cook food in unsanitary conditions and, here and there, a street corner will be suddenly overrun with rats. These kinds of dangers are hard to avoid in a city of more than 2.5 million people. The problem is, no one knows for certain where or when they will pop up.
The Chicago city government is hoping to change that by knitting powerful predictive models into its everyday city inspections. Its latest project, currently in pilot tests, analyses factors such as home inspection records and census data, and uses the results to guess which buildings are likely to cause lead poisoning in children – a problem that affects around 500,000 children in the US each year. The idea is to identify trouble spots before kids are exposed to dangerous lead levels.
“We are able to prevent problems instead of just respond to them,” says Jay Bhatt, chief innovation officer at the Chicago Department of Public Health. “These models are just the beginning of the use of predictive analytics in public health and we are excited to be at the forefront of these efforts.”
Chicago’s projects are based on the thinking that cities already have what they need to raise their municipal IQ: piles and piles of data. In 2012, city officials built WindyGrid, a platform that collected data like historical facts about buildings and up-to-date streams such as bus locations, tweets and 911 calls. The project was designed as a proof of concept and was never released publicly but it led to another, called Plenario, that allowed the public to access the data via an online portal.
The experience of building those tools has led to more practical applications. For example, one tool matches calls to the city’s municipal hotline complaining about rats with conditions that draw rats to a particular area, such as excessive moisture from a leaking pipe, or with an increase in complaints about garbage. This allows officials to proactively deploy sanitation crews to potential hotspots. It seems to be working: last year, resident requests for rodent control dropped by 15 per cent.
Some predictions are trickier to get right. Charlie Catlett, director of the Urban Center for Computation and Data in Chicago, is investigating an old axiom among city cops: that violent crime tends to spike when there’s a sudden jump in temperature. But he’s finding it difficult to test its validity in the absence of a plausible theory for why it might be the case. “For a lot of things about cities, we don’t have that underlying theory that tells us why cities work the way they do,” says Catlett.
Still, predictive modelling is maturing, as other cities succeed in using it to tackle urban ills….Such efforts can be a boon for cities, making them more productive, efficient and safe, says Rob Kitchin of Maynooth University in Ireland, who helped launched a real-time data site for Dublin last month called the Dublin Dashboard. But he cautions that there’s a limit to how far these systems can aid us. Knowing that a particular street corner is likely to be overrun with rats tomorrow doesn’t address what caused the infestation in the first place. “You might be able to create a sticking plaster or be able to manage it more efficiently, but you’re not going to be able to solve the deep structural problems….”
Traversing Digital Babel
New book by Alon Peled: “The computer systems of government agencies are notoriously complex. New technologies are piled on older technologies, creating layers that call to mind an archaeological dig. Obsolete programming languages and closed mainframe designs offer barriers to integration with other agency systems. Worldwide, these unwieldy systems waste billions of dollars, keep citizens from receiving services, and even—as seen in interoperability failures on 9/11 and during Hurricane Katrina—cost lives. In this book, Alon Peled offers a groundbreaking approach for enabling information sharing among public sector agencies: using selective incentives to “nudge” agencies to exchange information assets. Peled proposes the establishment of a Public Sector Information Exchange (PSIE), through which agencies would trade information.
After describing public sector information sharing failures and the advantages of incentivized sharing, Peled examines the U.S. Open Data program, and the gap between its rhetoric and results. He offers examples of creative public sector information sharing in the United States, Australia, Brazil, the Netherlands, and Iceland. Peled argues that information is a contested commodity, and draws lessons from the trade histories of other contested commodities—including cadavers for anatomical dissection in nineteenth-century Britain. He explains how agencies can exchange information as a contested commodity through a PSIE program tailored to an individual country’s needs, and he describes the legal, economic, and technical foundations of such a program. Touching on issues from data ownership to freedom of information, Peled offers pragmatic advice to politicians, bureaucrats, technologists, and citizens for revitalizing critical information flows.”
The Role Of Open Data In Choosing Neighborhood
PlaceILive Blog: “To what extent is it important to get familiar with our environment?
If we think about how the world surrounding us has changed throughout the years, it is not so unreasonable that, while walking to work, we might encounter some new little shops, restaurants, or gas stations we had never noticed before. Likewise, how many times did we wander about for hours just to find green spaces for a run? And the only one we noticed was even more polluted than other urban areas!
Citizens are not always properly informed about the evolution of the places they live in. And that is why it would be crucial for people to be constantly up-to-date with accurate information of the neighborhood they have chosen or are going to choose.
London is a neat evidence of how transparency in providing data is basic in order to succeed as a Smart City.
The GLA’s London Datastore, for instance, is a public platform of datasets revealing updated figures on the main services offered by the town, in addition to population’s lifestyle and environmental risks. These data are then made more easily accessible to the community through the London Dashboard.
The importance of dispensing free information can be also proved by the integration of maps, which constitute an efficient means of geolocation. Consulting a map where it’s easy to find all the services you need as close as possible can be significant in the search for a location.

(source: Smart London Plan)
The Open Data Index, published by The Open Knowledge Foundation in 2013, is another useful tool for data retrieval: it showcases a rank of different countries in the world with scores based on openness and availability of data attributes such as transport timetables and national statistics.
Here it is possible to check UK Open Data Census and US City Open Data Census.
As it was stated, making open data available and easily findable online not only represented a success for US cities but favoured apps makers and civic hackers too. Lauren Reid, a spokesperson at Code for America, reported according to Government Technology: “The more data we have, the better picture we have of the open data landscape.”
That is, on the whole, what Place I Live puts the biggest effort into: fostering a new awareness of the environment by providing free information, in order to support citizens willing to choose the best place they can live.
The outcome is soon explained. The website’s homepage offers visitors the chance to type address of their interest, displaying an overview of neighborhood parameters’ evaluation and a Life Quality Index calculated for every point on the map.
The research of the nearest medical institutions, schools or ATMs thus gets immediate and clear, as well as the survey about community’s generic information. Moreover, data’s reliability and accessibility are constantly examined by a strong team of professionals with high competence in data analysis, mapping, IT architecture and global markets.
For the moment the company’s work is focused on London, Berlin, Chicago, San Francisco and New York, while higher goals to reach include more than 200 cities.
US Open Data Census finally saw San Francisco’s highest score achievement as a proof of the city’s labour in putting technological expertise at everyone’s disposal, along with the task of fulfilling users’ needs through meticulous selections of datasets. This challenge seems to be successfully overcome by San Francisco’s new investment, partnering with the University of Chicago, in a data analytics dashboard on sustainability performance statistics named Sustainable Systems Framework, which is expected to be released in beta version by the the end of 2015’s first quarter.
Another remarkable collaboration in Open Data’s spread comes from the Bartlett Centre for Advanced Spatial Analysis (CASA) of the University College London (UCL); Oliver O’Brien, researcher at UCL Department of Geography and software developer at the CASA, is indeed one of the contributors to this cause.
Among his products, an interesting accomplishment is London’s CityDashboard, a real-time reports’ control panel in terms of spatial data. The web page also allows to visualize the whole data translated into a simplified map and to look at other UK cities’ dashboards.
Plus, his Bike Share Map is a live global view to bicycle sharing systems in over a hundred towns around the world, since bike sharing has recently drawn a greater public attention as an original form of transportation, in Europe and China above all….”
Why Are Political Scientists Studying Ice Bucket Challenges?
Fawn Johnson at the National Journal: “Who is more civically engaged—the person who votes in every election or the nonvoter who volunteers as a crossing guard at the local elementary school? What about the person who comments on an online news story? Does it count more if he posts the article on his Facebook page and urges his friends to act? What about the retired couple who takes care of the next-door neighbor’s kid after school until her single mom gets home from work?
The concept of civic engagement is mutating so fast that researchers are having a hard time keeping up with it. The Bureau of Labor Statistics has been collecting data on volunteering—defined as doing unpaid work through or for an organization—only since 2002. But even in that relatively short time period, that definition of “volunteering” has become far too limiting to cover the vast array of civic activity sprouting up online and in communities across the country.
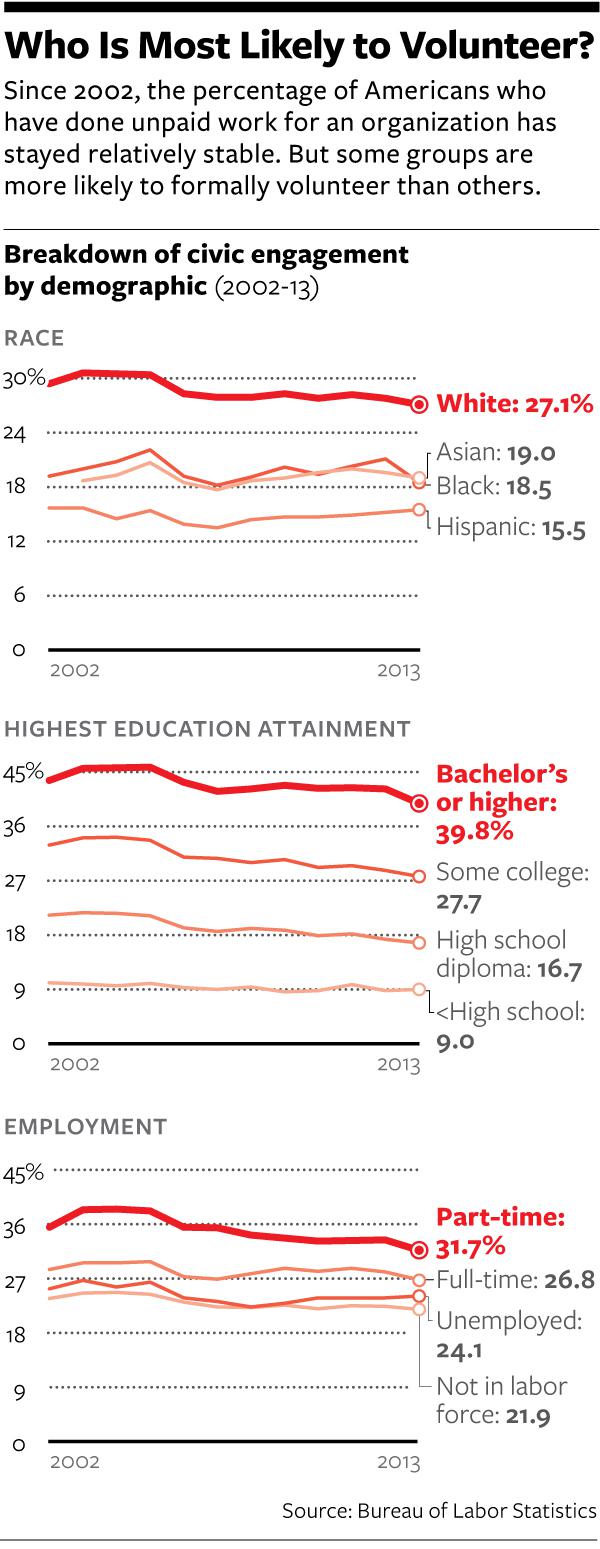
Here’s just one example: Based on the BLS data alone, you would think that whites who graduated from college are far more likely to volunteer than African Americans or Hispanics with only high school degrees. But the the BLS’s data doesn’t take into account the retired couple mentioned above, who, based on cultural norms, is more likely to be black or Hispanic. It doesn’t capture the young adults in poor neighborhoods who tell those researchers that they consider being a role model to younger kids their most important contribution to their communities. Researchers say those informal forms of altruism are more common among minority communities, while BLS-type “volunteering”—say, being a tutor to a disadvantaged child—is more common among middle-class whites. Moreover, the BLS’s data only scratches the surface of political involvement…”
Training Students to Extract Value from Big Data
New report by the National Research Council: “As the availability of high-throughput data-collection technologies, such as information-sensing mobile devices, remote sensing, internet log records, and wireless sensor networks has grown, science, engineering, and business have rapidly transitioned from striving to develop information from scant data to a situation in which the challenge is now that the amount of information exceeds a human’s ability to examine, let alone absorb, it. Data sets are increasingly complex, and this potentially increases the problems associated with such concerns as missing information and other quality concerns, data heterogeneity, and differing data formats.
The nation’s ability to make use of data depends heavily on the availability of a workforce that is properly trained and ready to tackle high-need areas. Training students to be capable in exploiting big data requires experience with statistical analysis, machine learning, and computational infrastructure that permits the real problems associated with massive data to be revealed and, ultimately, addressed. Analysis of big data requires cross-disciplinary skills, including the ability to make modeling decisions while balancing trade-offs between optimization and approximation, all while being attentive to useful metrics and system robustness. To develop those skills in students, it is important to identify whom to teach, that is, the educational background, experience, and characteristics of a prospective data-science student; what to teach, that is, the technical and practical content that should be taught to the student; and how to teach, that is, the structure and organization of a data-science program.
Training Students to Extract Value from Big Data summarizes a workshop convened in April 2014 by the National Research Council’s Committee on Applied and Theoretical Statistics to explore how best to train students to use big data. The workshop explored the need for training and curricula and coursework that should be included. One impetus for the workshop was the current fragmented view of what is meant by analysis of big data, data analytics, or data science. New graduate programs are introduced regularly, and they have their own notions of what is meant by those terms and, most important, of what students need to know to be proficient in data-intensive work. This report provides a variety of perspectives about those elements and about their integration into courses and curricula…”
3D printed maps could help the blind navigate their city
Springwise: “Modern technology has turned many of the things we consume from physical objects into pixels on a screen. While this has benefited the majority of us, those with sight difficulties don’t get along well with visual stimuli or touchscreen devices. In the past, we’ve seen Yahoo! Japan develop Hands On Search, a project that lets blind kids carry out web searches with 3D printed results. Now the country’s governmental department GSI is creating software that will enable those with visual impairments to print out 3D versions of online maps.
The official mapping body for Japan — much like the US Geological Survey — GSI already has paper maps for the blind, using embossed surfaces to mark out roads. It’s now developing a program that is able to do the same thing for digital maps.
The software first differentiates the highways, railway lines and walkways from the rest of the landscape. It then creates a 3D relief model that uses different textures to distinguish the features so that anyone running their finger along them will be able to determine what it is. The program also takes into account contour lines, creating accurate topographical representations of a particular area….
Website: www.gsi.go.jp“
Peer Academy
About: “Peer Academy inspires change through peer-to-peer learning. Our goal is simple, to bring together innovators and collaborators across Corporate, Government and Not For Profits who are passionate about accelerating change in their organisations. Focussed on the skills needed for the 21st century, Peer Academy provides a platform for professionals to increase their capabilities through sharing skills, tools and knowledge…
As we enter into the collaborative economy, people will demand collaborative and flexible ways of learning. As people change jobs more frequently, the need for new skills will change in variety and pace.
Currently, many education delivery models are not keeping up with the pace of job or career changes. Internal options are often compliance-based and lack inspiration for 21st century skills. External options can be expensive or time consuming, making it a difficult pitch where budgets and resources for many organisations are getting tighter. Finally, many of us want to move beyond the expert vs student paradigm and would rather learn from peers who have gone down the tricky path we are venturing on.
We need a new education paradigm for professional development. One where learning happens on-demand, is low-cost, practical and peer-led. This is where Peer Academy comes in…”
The Data Manifesto
Development Initiatives: “Staging a Data Revolution
Accessible, useable, timely and complete data is core to sustainable development and social progress. Access to information provides people with a base to make better choices and have more control over their lives. Too often attempts to deliver sustainable economic, social and environmental results are hindered by the failure to get the right information, in the right format, to the right people, at the right time. Worse still, the most acute data deficits often affect the people and countries facing the most acute problems.
The Data Revolution should be about data grounded in real life. Data and information that gets to the people who need it at national and sub-national levels to help with the decisions they face – hospital directors, school managers, city councillors, parliamentarians. Data that goes beyond averages – that is disaggregated to show the different impacts of decisions, policies and investments on gender, social groups and people living in different places and over time.
We need a Data Revolution that sets a new political agenda, that puts existing data to work, that improves the way data is gathered and ensures that information can be used. To deliver this vision, we need the following steps.
12 steps to a Data Revolution
1. Implement a national ‘Data Pledge’ to citizens that is supported by governments, private and non-governmental sectors
2. Address real world questions with joined up and disaggregated data
3. Empower and up-skill data users of the future through education
4. Examine existing frameworks and publish existing data
5. Build an information bank of data assets
6. Allocate funding available for better data according to national and sub-national priorities
7. Strengthen national statistical systems’ capacity to collect data
8. Implement a policy that data is ‘open by default’
9. Improve data quality by subjecting it to public scrutiny
10. Put information users’ needs first
11. Recognise technology cannot solve all barriers to information
12. Invest in infomediaries’ capacity to translate data into information that policymakers, civil society and the media can actually use…”