Stefaan Verhulst
Cass Sunstein in the New York Times: “In recent years, the federal government has adopted a large number of soft interventions that are meant to change behavior without mandates and bans. Among them: disclosure of information, such as calorie labels at chain restaurants; graphic warnings against, for example, distracted driving; and automatic enrollment in programs designed to benefit employees, like pension plans.
Informed by behavioral science, such reforms can have large effects while preserving freedom of choice. But skeptics deride these soft interventions as unjustified paternalism, an insult to dignity and a contemporary version of the nanny state. Some people fear that uses of behavioral science will turn out to be manipulative. They don’t want to be nudged.
But what do Americans actually think about soft interventions? I recently conducted a nationally representative survey of 563 people. Small though that number may seem, it gives a reasonable picture of what Americans think, with a margin of error of plus or minus 4.1 percentage points.
The remarkable finding is that most Americans approve of these reforms and want a lot more of them — and their approval generally cuts across partisan lines….(More)
New report byTom Saunders and Peter Baeck (NESTA): “This report tells the stories of cities around the world – from Beijing to Amsterdam, and from London to Jakarta – that are addressing urban challenges by using digital technologies to engage and enable citizens.
Key findings
- Many ‘top down’ smart city ideas have failed to deliver on their promise, combining high costs and low returns.
- ‘Collaborative technologies’ offer cities another way to make smarter use of resources, smarter ways of collecting data and smarter ways to make decisions.
- Collaborative technologies can also help citizens themselves shape the future of their cities.
- We have created five recommendations for city government who want to make their cities smarter.
As cities bring people together to live, work and play, they amplify their ability to create wealth and ideas. But scale and density also bring acute challenges: how to move around people and things; how to provide energy; how to keep people safe.
‘Smart cities’ offer sensors, ‘big data’ and advanced computing as answers to these challenges, but they have often faced criticism for being too concerned with hardware rather than with people.
In this report we argue that successful smart cities of the future will combine the best aspects of technology infrastructure while making the most of the growing potential of ‘collaborative technologies’, technologies that enable greater collaboration between urban communities and between citizens and city governments.
How will this work in practice? Drawing on examples from all around the world we investigate four emerging methods which are helping city governments engage and enable citizens: the collaborative economy, crowdsourcing data, collective intelligence and crowdfunding.
Policy recommendations
- Set up a civic innovation lab to drive innovation in collaborative technologies.
- Use open data and open platforms to mobilise collective knowledge.
- Take human behaviour as seriously as technology.
- Invest in smart people, not just smart technology.
- Spread the potential of collaborative technologies to all parts of society….(More)”
Michelle N. Meyer and Christopher Chabris in the New York Times: ” Can it ever be ethical for companies or governments to experiment on their employees, customers or citizens without their consent?
The conventional answer — of course not! — animated public outrage last year after Facebook published a study in which it manipulated how much emotional content more than half a million of its users saw. Similar indignation followed the revelation by the dating site OkCupid that, as an experiment, it briefly told some pairs of users that they were good matches when its algorithm had predicted otherwise.
But this outrage is misguided. Indeed, we believe that it is based on a kind of moral illusion.
Companies — and other powerful actors, including lawmakers, educators and doctors — “experiment” on us without our consent every time they implement a new policy, practice or product without knowing its consequences. When Facebook started, it created a radical new way for people to share emotionally laden information, with unknown effects on their moods. And when OkCupid started, it advised users to go on dates based on an algorithm without knowing whether it worked.
Why does one “experiment” (i.e., introducing a new product) fail to raise ethical concerns, whereas a true scientific experiment (i.e., introducing a variation of the product to determine the comparative safety or efficacy of the original) sets off ethical alarms?
In a forthcoming article in the Colorado Technology Law Journal, one of us (Professor Meyer) calls this the “A/B illusion” — the human tendency to focus on the risk, uncertainty and power asymmetries of running a test that compares A to B, while ignoring those factors when A is simply imposed by itself.
Consider a hypothetical example. A chief executive is concerned that her employees are taking insufficient advantage of the company’s policy of matching contributions to retirement savings accounts. She suspects that telling her workers how many others their age are making the maximum contribution would nudge them to save more, so she includes this information in personalized letters to them.
If contributions go up, maybe the new policy worked. But perhaps contributions would have gone up anyhow (say, because of an improving economy). If contributions go down, it might be because the policy failed. Or perhaps a declining economy is to blame, and contributions would have gone down even more without the letter.
You can’t answer these questions without doing a true scientific experiment — in technology jargon, an “A/B test.” The company could randomly assign its employees to receive either the old enrollment packet or the new one that includes the peer contribution information, and then statistically compare the two groups of employees to see which saved more.
Let’s be clear: This is experimenting on people without their consent, and the absence of consent is essential to the validity of the entire endeavor. If the C.E.O. were to tell the workers that they had been randomly assigned to receive one of two different letters, and why, that information would be likely to distort their choices.
Our chief executive isn’t so hypothetical. Economists do help corporations run such experiments, but many managers chafe at debriefing their employees afterward, fearing that they will be outraged that they were experimented on without their consent. A company’s unwillingness to debrief, in turn, can be a deal-breaker for the ethics boards that authorize research. So those C.E.O.s do what powerful people usually do: Pick the policy that their intuition tells them will work best, and apply it to everyone….(More)”
Book edited by Jon Elster: “In the spirit of Jeremy Bentham’s Political Tactics, this volume offers the first comprehensive discussion of the effects of secrecy and publicity on debates and votes in committees and assemblies. The contributors – sociologists, political scientists, historians, and legal scholars – consider the micro-technology of voting (the devil is in the detail), the historical relations between the secret ballot and universal suffrage, the use and abolition of secret voting in parliamentary decisions, and the sometimes perverse effects of the drive for greater openness and transparency in public affairs. The authors also discuss the normative questions of secret versus public voting in national elections and of optimal mixes of secrecy and publicity, as well as the opportunities for strategic behavior created by different voting systems. Together with two previous volumes on Collective Wisdom (Cambrige, 2012) and Majority Decisions (Cambridge, 2014), the book sets a new standard for interdisciplinary work on collective decision-making….(More)”
Book by Irene S. Wu: “Bloggers in India used social media and wikis to broadcast news and bring humanitarian aid to tsunami victims in South Asia. Terrorist groups like ISIS pour out messages and recruit new members on websites. The Internet is the new public square, bringing to politics a platform on which to create community at both the grassroots and bureaucratic level. Drawing on historical and contemporary case studies from more than ten countries, Irene S. Wu’s Forging Trust Communities argues that the Internet, and the technologies that predate it, catalyze political change by creating new opportunities for cooperation. The Internet does not simply enable faster and easier communication, but makes it possible for people around the world to interact closely, reciprocate favors, and build trust. The information and ideas exchanged by members of these cooperative communities become key sources of political power akin to military might and economic strength.
Wu illustrates the rich world history of citizens and leaders exercising political power through communications technology. People in nineteenth-century China, for example, used the telegraph and newspapers to mobilize against the emperor. In 1970, Taiwanese cable television gave voice to a political opposition demanding democracy. Both Qatar (in the 1990s) and Great Britain (in the 1930s) relied on public broadcasters to enhance their influence abroad. Additional case studies from Brazil, Egypt, the United States, Russia, India, the Philippines, and Tunisia reveal how various technologies function to create new political energy, enabling activists to challenge institutions while allowing governments to increase their power at home and abroad.
Forging Trust Communities demonstrates that the way people receive and share information through network communities reveals as much about their political identity as their socioeconomic class, ethnicity, or religion. Scholars and students in political science, public administration, international studies, sociology, and the history of science and technology will find this to be an insightful and indispensable work…(More)”
Kurzweil News: “Computers can now do fact-checking for any body of knowledge, according to Indiana University network scientists, writing in an open-access paper published June 17 in PLoS ONE.
Using factual information from summary infoboxes from Wikipedia* as a source, they built a “knowledge graph” with 3 million concepts and 23 million links between them. A link between two concepts in the graph can be read as a simple factual statement, such as “Socrates is a person” or “Paris is the capital of France.”
In the first use of this method, IU scientists created a simple computational fact-checker that assigns “truth scores” to statements concerning history, geography and entertainment, as well as random statements drawn from the text of Wikipedia. In multiple experiments, the automated system consistently matched the assessment of human fact-checkers in terms of the humans’ certitude about the accuracy of these statements.
Dealing with misinformation and disinformation
In what the IU scientists describe as an “automatic game of trivia,” the team applied their algorithm to answer simple questions related to geography, history, and entertainment, including statements that matched states or nations with their capitals, presidents with their spouses, and Oscar-winning film directors with the movie for which they won the Best Picture awards. The majority of tests returned highly accurate truth scores.
Lastly, the scientists used the algorithm to fact-check excerpts from the main text of Wikipedia, which were previously labeled by human fact-checkers as true or false, and found a positive correlation between the truth scores produced by the algorithm and the answers provided by the fact-checkers.
Significantly, the IU team found their computational method could even assess the truthfulness of statements about information not directly contained in the infoboxes. For example, the fact that Steve Tesich — the Serbian-American screenwriter of the classic Hoosier film “Breaking Away” — graduated from IU, despite the information not being specifically addressed in the infobox about him.
Using multiple sources to improve accuracy and richness of data
“The measurement of the truthfulness of statements appears to rely strongly on indirect connections, or ‘paths,’ between concepts,” said Giovanni Luca Ciampaglia, a postdoctoral fellow at the Center for Complex Networks and Systems Research in the IU Bloomington School of Informatics and Computing, who led the study….
“These results are encouraging and exciting. We live in an age of information overload, including abundant misinformation, unsubstantiated rumors and conspiracy theories whose volume threatens to overwhelm journalists and the public. Our experiments point to methods to abstract the vital and complex human task of fact-checking into a network analysis problem, which is easy to solve computationally.”
Expanding the knowledge base
Although the experiments were conducted using Wikipedia, the IU team’s method does not assume any particular source of knowledge. The scientists aim to conduct additional experiments using knowledge graphs built from other sources of human knowledge, such as Freebase, the open-knowledge base built by Google, and note that multiple information sources could be used together to account for different belief systems….(More)”
Balancing Act is a web app that displays a straightforward pie chart of a city’s budget, broken down into categories like pensions, parks & recreations, police, and education. But it doesn’t just display the current budget breakdown. It invites users to tweak it, expressing their own priorities, all while keeping the city in the black. Do you want your libraries to be better funded? Fine—but you’re going to have to raise property taxes to do it.
“Balancing Act provides a way for people to both understand what public entities are doing and then to weight that against the other possible things that government can do,” says Chris Adams, president of Engaged Public, a Colorado-based consulting firm that develops technology for government and non-profits. “Especially in this era of information, all of us have a responsibility to spend a bit of time understanding how our government is spending money on our behalf.”
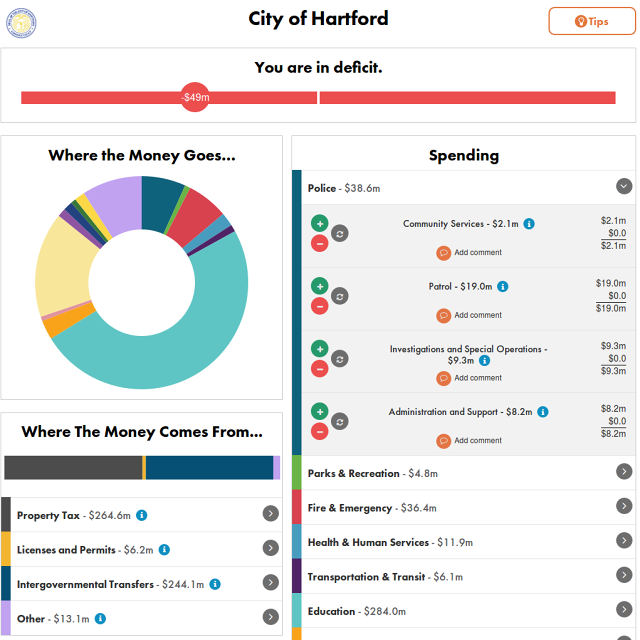
Hartford, Connecticut is the first city in the country that is using Balancing Act. The city was facing a $49 million budget deficit this spring, and Mayor Pedro Segarra says he took input from citizens using Balancing Act. Meanwhile, in Engaged Public’s home state, residents can input their income to generate an itemized tax receipt and then tweak the Colorado state budget as they see fit.
Engaged Public hopes that by making budgets more interactive and accessible, more people will take an interest in them.
“Budget information almost universally exists, but it’s not in accessible formats—mostly they’re in PDF files,” says Adams. “So citizens are invited to pour through tens of thousands of pages of PDFs. But that really doesn’t give you a high-level understanding of what’s at stake in a reasonable amount of time.”
If widely used, Balancing Act could be a useful tool for politicians to check the pulse of their constituents. For example, decreasing funding to parks draws a negative public reaction. But if enough people on Balancing Act experimented with the budget, saw the necessity of it, and submitted their recommendations, then an elected might be willing to make a decision that would otherwise seem politically risky….(More)”
PSFK Labs: “While being sick is never a good situation to be in, the majority of people can still take solace in the fact that modern medicine will be able to diagnose their problem and get them on the path to a quick recovery. For a small percentage of patients, however, simply finding out what ails them can be a challenge. Despite countless visits to specialists and mounting costs, these individuals can struggle for years to find out any reliable information about their illness.
This is only exacerbated by the fact that in a heavily regulated industry like healthcare, words like “personalization,” “transparency” and “collaboration” are near impossibilities, leaving these patients locked into a system that can’t care for them. Enter CrowdMed, an online platform that uses the combined knowledge of its community to overcome these obstacles, getting people the answers and treatment they need.
…we spoke with Jared Heyman, the company’s founder, to understand how the crowd can deliver unprecedented efficiencies to a system sorely in need of them…. “CrowdMed harnesses the wisdom of crowds to solve the world’s most difficult medical cases online. Let’s say that you’ve been bouncing doctor to doctor, but don’t yet have a definitive diagnosis or treatment plan. You can submit your case on our site by answering an in‑depth patient questionnaire, uploading relevant medical records, diagnostic test results or even medical images. We expose your case to our community of currently over 15,000 medical detectives. These are people mostly with medical backgrounds who enjoy solving these challenges.
We have about a 70 percent success rate, bringing patients closer to a direct diagnosis or cure and we do so in a very small fraction of the time and cost of what it would take through the traditional medical system….
Every entrepreneur builds upon the tools and technologies that preceded them. I think that CrowdMed needed the Internet. It needed Facebook. It needed Wikipedia. It needed Quora, and other companies or products that have proven that you can trust in the wisdom of the crowd. I think we’re built upon the shoulders of these other companies.
We looked at all these other companies that have proven the value of social networks through crowdsourcing, and that’s inspired us to do what we do. It’s been instructive for us in the best way to do it, and it’s also prepared society, psychologically and culturally, for what we’re doing. All these things were important….(More)”
John Kamensky in GovExec: “Can we shift the conversation in Washington from “waste, fraud, and abuse” to “what works and let’s fund it” instead?
I attended a recent Senate hearing on wasteful spending in the federal government, and some of the witnesses pointed to examples such as the legislative requirement that the Defense Department ship coal to Germany to heat American bases there. Others pointed to failures of large-scale computer projects and the dozens of programs on the Government Accountability Office’s High Risk List.
While many of the examples were seen as shocking, there was little conversation about focusing on what works and expanding those programs.
Interestingly, there is a movement underway across the U.S. to do just that. There are advocacy groups, foundations, states and localities promoting the idea of “let’s find out what works and fund it.” Some call this “evidence-based government,” “Moneyball government,” or “pay for success.” The federal government has dipped its toes in the water, a well, with several pilot programs in various agencies and bipartisan legislation pending in Congress.
The hot, new thing that has captured the imaginations of many policy wonks is called “Pay for Success,” or in some circles, “social impact bonds.”
In 2010, the British government launched an innovative funding scheme, which it called social impact bonds, where private sector investors committed funding upfront to pay for improved social outcomes that result in public sector savings. The investors were repaid by the government only when the outcomes were determined to have been achieved.
This funding scheme has attracted substantial attention in the U.S. where it and many variations are being piloted.
What is “Pay for Success?” According to the Urban Institute, PFS is a type of performance-based contracting used to support the delivery of targeted, high-impact preventive social services, in which intervention at an early stage can reduce the need for higher-cost services in the future.
For example, experts believe that preventing asthma attacks among at-risk children reduces emergency room visits and hospitalization, which are more costly than preventive services. When the government pays for preventive services, it hopes to lower its costs….(More)”
 “As part of the Wisdom of the Crowd project, Ipsos MORI and Demos have conducted a review of the current literature around social media research ethics. The report explores the current legal and regulatory frameworks in the UK and identifying where guidelines may need to be updated…(Full Report) “