Stefaan Verhulst
BioMedCentral Blog: ” The 5th Annual Oxford London Lecture (17 March 2015) was delivered by Professor Susan Jebb from Oxford University. The presentation was titled: ‘Knowledge, nudge and nanny: Opportunities to improve the nation’s diet’. In this guest blog Dr Helen Walls, Research Fellow at the London School of Hygiene and Tropical Medicine, covers key themes from this presentation.
“Obesity and related non-communicable disease such as diabetes, heart disease and cancer poses a significant health, social and economic burden in countries worldwide, including the United Kingdom. Whilst the need for action is clear, the nutrition policy response is a highly controversial topic. Professor Jebb raised the question of how best to achieve dietary change: through ‘knowledge, nudge or nanny’?
Education regarding healthy nutrition is an important strategy, but insufficient. People are notoriously bad at putting their knowledge to work. The inclination to overemphasise the importance of knowledge, whilst ignoring the influence of environmental factors on human behaviours, is termed the ‘fundamental attribution error’. Education may also contribute to widening inequities.
Our choices are strongly shaped by the environments in which we live. So if ‘knowledge’ is not enough, what sort of interventions are appropriate? This raises questions regarding individual choice and the role of government. Here, Professor Jebb introduced the Nuffield Intervention Ladder.
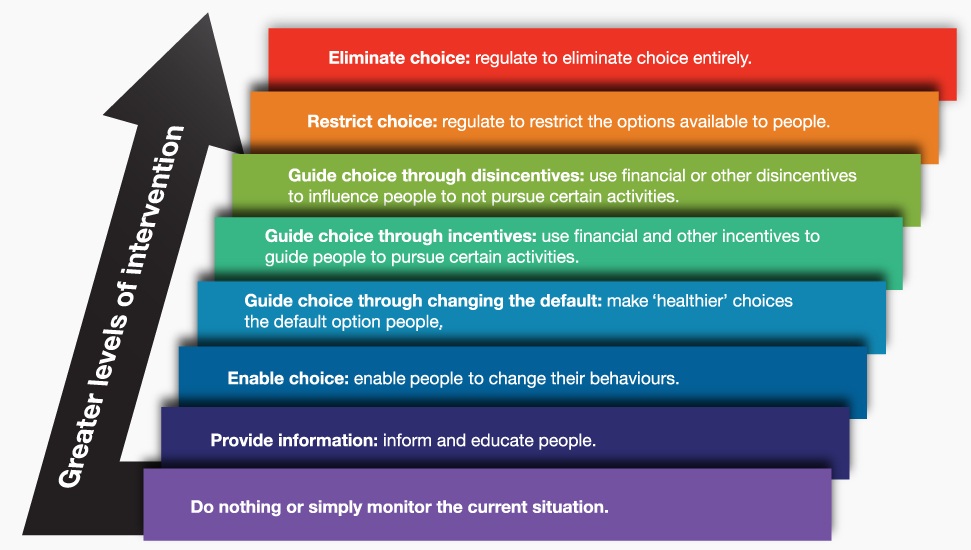
The Nuffield Intervention Ladder or what I will refer to as ‘the ladder’ describes intervention types from least to most intrusive on personal choice. With addressing diets and obesity, Professor Jebb believes we need a range of policy types, across the range of rungs on the ladder.
Less intrusive measures on the ladder could include provision of information about healthy and unhealthy foods, and provision of nutritional information on products (which helps knowledge be put into action). More effective than labelling is the signposting of healthier choices.
Taking a few steps up the ladder brings in ‘nudge’, a concept from behavioural economics. A nudge is any aspect of the choice architecture that alters people’s behaviour in a predictable way without forbidding options or significantly changing economic incentives. Nudges are not mandates. Putting fruit at eye level counts as a nudge. Banning junk food does not.
Nudges are not mandates. Putting fruit at eye level counts as a nudge. Banning junk food does not.
The in-store environment has a huge influence over our choices, and many nudge options would fit here. For example, gondalar-end (end of aisle) promotions create a huge up-lift in sales. Removing unhealthy products from this position could make a considerable difference to the contents of supermarket baskets.
Nudge could be used to assist people make better nutritional choices, but it’s also unlikely to be enough. We celebrate the achievement we have made with tobacco control policies and smoking reduction. Here, we use a range of intervention types, including many legislative measures – the ‘nanny’ aspect of the title of this presentation….(More)”
Review by Michael Czerny: “Sentiment analysis is a common application of Natural Language Processing (NLP) methodologies, particularly classification, whose goal is to extract the emotional content in text. In this way, sentiment analysis can be seen as a method to quantify qualitative data with some sentiment score. While sentiment is largely subjective, sentiment quantification has enjoyed many useful implementations, such as businesses gaining understanding about consumer reactions to a product, or detecting hateful speech in online comments.
The simplest form of sentiment analysis is to use a dictionary of good and bad words. Each word in a sentence has a score, typically +1 for positive sentiment and -1 for negative. Then, we simply add up the scores of all the words in the sentence to get a final sentiment total. Clearly, this has many limitations, the most important being that it neglects context and surrounding words. For example, in our simple model the phrase “not good” may be classified as 0 sentiment, given “not” has a score of -1 and “good” a score of +1. A human would likely classify “not good” as negative, despite the presence of “good”.
Another common method is to treat a text as a “bag of words”. We treat each text as a 1 by N vector, where N is the size of our vocabulary. Each column is a word, and the value is the number of times that word appears. For example, the phrase “bag of bag of words” might be encoded as [2, 2, 1]. This could then be fed into a machine learning algorithm for classification, such as logistic regression or SVM, to predict sentiment on unseen data. Note that this requires data with known sentiment to train on in a supervised fashion. While this is an improvement over the previous method, it still ignores context, and the size of the data increases with the size of the vocabulary.
Word2Vec and Doc2Vec
Recently, Google developed a method called Word2Vec that captures the context of words, while at the same time reducing the size of the data. Word2Vec is actually two different methods: Continuous Bag of Words (CBOW) and Skip-gram. In the CBOW method, the goal is to predict a word given the surrounding words. Skip-gram is the converse: we want to predict a window of words given a single word (see Figure 1). Both methods use artificial neural networks as their classification algorithm. Initially, each word in the vocabulary is a random N-dimensional vector. During training, the algorithm learns the optimal vector for each word using the CBOW or Skip-gram method….(More)“
Jill Lepore about Magna Carta, the Bill of Rights, and the hold of time in The New Yorker: “…Magna Carta has been taken as foundational to the rule of law, chiefly because in it King John promised that he would stop throwing people into dungeons whenever he wished, a provision that lies behind what is now known as due process of law and is understood not as a promise made by a king but as a right possessed by the people. Due process is a bulwark against injustice, but it wasn’t put in place in 1215; it is a wall built stone by stone, defended, and attacked, year after year. Much of the rest of Magna Carta, weathered by time and for centuries forgotten, has long since crumbled, an abandoned castle, a romantic ruin.
Magna Carta is written in Latin. The King and the barons spoke French. “Par les denz Dieu!” the King liked to swear, invoking the teeth of God. The peasants, who were illiterate, spoke English. Most of the charter concerns feudal financial arrangements (socage, burgage, and scutage), obsolete measures and descriptions of land and of husbandry (wapentakes and wainages), and obscure instruments for the seizure and inheritance of estates (disseisin and mort d’ancestor). “Men who live outside the forest are not henceforth to come before our justices of the forest through the common summonses, unless they are in a plea,” one article begins.
Magna Carta’s importance has often been overstated, and its meaning distorted. “The significance of King John’s promise has been anything but constant,” U.S. Supreme Court Justice John Paul Stevens aptly wrote, in 1992. It also has a very different legacy in the United States than it does in the United Kingdom, where only four of its original sixty-some provisions are still on the books. In 2012, three New Hampshire Republicans introduced into the state legislature a bill that required that “all members of the general court proposing bills and resolutions addressing individual rights or liberties shall include a direct quote from the Magna Carta which sets forth the article from which the individual right or liberty is derived.” For American originalists, in particular, Magna Carta has a special lastingness. “It is with us every day,” Justice Antonin Scalia said in a speech at a Federalist Society gathering last fall.
Much has been written of the rule of law, less of the rule of history. Magna Carta, an agreement between the King and his barons, was also meant to bind the past to the present, though perhaps not in quite the way it’s turned out. That’s how history always turns out: not the way it was meant to. In preparation for its anniversary, Magna Carta acquired a Twitter username: @MagnaCarta800th….(More)”
Paper by Michael Curtotti, Wayne Weibel, Eric McCreath, Nicolas Ceynowa, Sara Frug, and Tom R Bruce: “This paper sits at the intersection of citizen access to law, legal informatics and plain language. The paper reports the results of a joint project of the Cornell University Legal Information Institute and the Australian National University which collected thousands of crowdsourced assessments of the readability of law through the Cornell LII site. The aim of the project is to enhance accuracy in the prediction of the readability of legal sentences. The study requested readers on legislative pages of the LII site to rate passages from the United States Code and the Code of Federal Regulations and other texts for readability and other characteristics. The research provides insight into who uses legal rules and how they do so. The study enables conclusions to be drawn as to the current readability of law and spread of readability among legal rules. The research is intended to enable the creation of a dataset of legal rules labelled by human judges as to readability. Such a dataset, in combination with machine learning, will assist in identifying factors in legal language which impede readability and access for citizens. As far as we are aware, this research is the largest ever study of readability and usability of legal language and the first research which has applied crowdsourcing to such an investigation. The research is an example of the possibilities open for enhancing access to law through engagement of end users in the online legal publishing environment for enhancement of legal accessibility and through collaboration between legal publishers and researchers….(More)”
 IEEE Spectrum: “Fifty years ago this month, Gordon Moore forecast a bright future for electronics. His ideas were later distilled into a single organizing principle—Moore’s Law—that has driven technology forward at a staggering clip. We have all benefited from this miraculous development, which has forcefully shaped our modern world.
In this special report, we find that the end won’t be sudden and apocalyptic but rather gradual and complicated. Moore’s Law truly is the gift that keeps on giving—and surprising, as well….(More)”
Review by Emmie Tran and Ginny Scholtes: “Open data describes large datasets that governments at all levels release online and free of charge for analysis by anyone for any purpose. Entrepreneurs may use open data to create new products and services, and citizens may use it to gain insight into the government. A plethora of time saving and other useful applications have emerged from open data feeds, including more accurate traffic information, real-time arrival of public transportation, and information about crimes in neighborhoods. But data held by the government is implicitly or explicitly about individuals. While open government is often presented as an unqualified good, sometimes open data can identify individuals or groups, leading to invasions of privacy and disparate impact on vulnerable populations.
This review provides background to parties interested in open data, specifically for those attending the 19th Annual BCLT/BTLJ Symposium on open data. Part I defines open data, focusing on the origins of the open data movement and the types of data subject to government retention and public access. Part II discusses how open data can benefit society, and Part III delves into the many challenges and dangers of open data. Part IV addresses these challenges, looking at how the United States and other countries have implemented open data regimes, and considering some of the proposed measures to mitigate the dangers of open data….(More)”
Paper by Amy Smith: “This paper considers how crowdsourcing applications and crowdsourced data are currently being applied, as well as potential new uses for active transportation research and planning efforts of various types. The objectives of this white paper are to review crowdsourced bicycle and pedestrian data resources and crowdsourcing tools; discuss potential planning implementations of crowdsourced data for a variety of bicycle and pedestrian project types; and provide examples of how crowdsourcing is currently being used by the planning community. Due to software application turnover, many of the examples provided describe tools that may no longer be in use, have evolved significantly, or have been/will eventually be depreciated with the advance of new technologies. This paper is not intended to be a comprehensive outline of crowdsourcing applications in the transportation planning profession or a dictionary of crowdsourcing system types, but rather a resource for those interested in using crowdsourcing systems in active transportation planning and research. (Full Paper)”
Alla Morrison at World Bank Open Data blog: “Was there a class of entrepreneurs emerging to take advantage of the economic possibilities offered by open data, were investors keen to back such companies, were governments tuned to and responsive to the demands of such companies, and what were some of the key financing challenges and opportunities in emerging markets? As we began our work on the concept of an Open Fund, we partnered with Ennovent (India), MDIF (East Asia and Latin America) and Digital Data Divide (Africa) to conduct short market surveys to answer these questions, with a focus on trying to understand whether a financing gap truly existed in these markets. The studies were fairly quick (4-6 weeks) and reached only a small number of companies (193 in India, 70 in Latin America, 63 in South East Asia, and 41 in Africa – and not everybody responded) but the findings were fairly consistent.
- Open data is still a very nascent concept in emerging markets. and there’s only a small class of entrepreneurs/investors that is aware of the economic possibilities; there’s a lot of work to do in the ‘enabling environment’
- In many regions the distinction between open data, big data, and private sector generated/scraped/collected data was blurry at best among entrepreneurs and investors (some of our findings consequently are better indicators of data-driven rather than open data-driven businesses)
- There’s a small but growing number of open data-driven companies in all the markets we surveyed and these companies target a wide range of consumers/users and are active in multiple sectors
- A large percentage of identified companies operate in sectors with high social impact – health and wellness, environment, agriculture, transport. For instance, in India, after excluding business analytics companies, a third of data companies seeking financing are in healthcare and a fifth in food and agriculture, and some of them have the low-income population or the rural segment of India as an intended beneficiary segment. In Latin America, the number of companies in business services, research and analytics was closely followed by health, environment and agriculture. In Southeast Asia, business, consumer services, and transport came out in the lead.
- We found the highest number of companies in Latin America and Asia with the following countries leading the way – Mexico, Chile, and Brazil, with Colombia and Argentina closely behind in Latin America; and India, Indonesia, Philippines, and Malaysia in Asia
- An actionable pipeline of data-driven companies exists in Latin America and in Asia
- We heard demand for different kinds of financing (equity, debt, working capital) but the majority of the need was for equity and quasi-equity in amounts ranging from $100,000 to $5 million USD, with averages of between $2 and $3 million USD depending on the region.
- There’s a significant financing gap in all the markets
- The investment sizes required, while they range up to several million dollars, are generally small. Analysis of more than 300 data companies in Latin America and Asia indicates a total estimated need for financing of more than $400 million
- Venture capitals generally don’t recognize data as a separate sector and club data-driven companies with their standard information communication technology (ICT) investments
- Interviews with founders suggest that moving beyond seed stage is particularly difficult for data-driven startups. While many companies are able to cobble together an initial seed round augmented by bootstrapping to get their idea off the ground, they face a great deal of difficulty when trying to raise a second, larger seed round or Series A investment.
- From the perspective of startups, investors favor banal e-commerce (e.g., according toTech in Asia, out of the $645 million in technology investments made public across the region in 2013, 92% were related to fashion and online retail) or consumer service startups and ignore open data-focused startups even if they have a strong business model and solid key performance indicators. The space is ripe for a long-term investor with a generous risk appetite and multiple bottom line goals.
- Poor data quality was the number one issue these companies reported.
- Companies reported significant waste and inefficiency in accessing/scraping/cleaning data.
The analysis below borrows heavily from the work done by the partners. We should of course mention that the findings are provisional and should not be considered authoritative (please see the section on methodology for more details)….(More).”
The undertakings were released at a White House climate and health conference where John Holdren, director of the White House Office of Science and Technology Policy, pressed the need for greater data to compel decreases to greenhouse emissions.
“This is a science-based administration, a fact-based administration, and our climate policies have to be based on fact, have to be based on data, and we want to make those data available to everybody,” Holdren said.
The data initiative touches multiple agencies — including NASA, the Centers for Disease Control and Prevention, the National Institutes of Health and the Environmental Protection Agency — and is part of the White House proclamation of a new National Public Health Week, from April 6 to April 12, to spur national health solutions and awareness.
The 150-plus data sets are all connected to health, and are among the 560 climate-related data sets available on Data.gov, the U.S. government’s open data portal. Accompanying the release, the Department of Health and Human Services added a Health Care Facilities Toolkit on Toolkit.climate.gov, a site that delivers climate resilience techniques, strategies, case studies and tools for organizations attempting climate change initiatives.
Holdren was followed by White House Chief Data Scientist D.J. Patil, who moderated a tech industry panel with representatives from Google, Microsoft and GIS mapping software company Esri.
Google Earth Outreach Program Manager Allison Lieber confirmed that Google will continue to provide assistance with 10 million hours for high-performance computing for climate data projects — down from 50 million in 2014 — and the company will likewise provide climate data hosting on Google Earth….(More)”
Joshua Chambers at FutureGov: “…two public servants in Western Australia have come up with an alternative way of pushing forwards their government’s digital delivery.
Their new project, Ready Steady Gov, provides free web templates based on an open source CMS so that any agency can quickly upgrade their web site, for free. The officials’ templates are based on the web site guidance published by the state: the Web Governance Framework and the Common Website Elements documentation.
The site was motivated by a desire to quickly improve government web sites. “I’m sure you’ve heard the phrase… ‘Everything takes longer in government’. We want building websites to become an exception to this rule,” wrote Jessy Yuen and Vincent Manera, the project’s founders.
They have created five open source templates “which are lightly styled so that you can easily integrate your own branding”. They are responsive so that they fit all screen sizes, and meet the required accessibility standards….(More)”
