Laura Bliss at CityLab: “The Library of Congress‘ online presence is a temple of American history, an unmatched, searchable collection of digitized photographs, maps, recordings, sheet music, and documents in the millions, dating back to the 15th century.
Sifting through these treasures isn’t so easy, though. When you do manage the clunky search interface and stumble across a gorgeous 1870s statistical atlas, it’s hard to zoom in closely on its pages and properly marvel at the antique gem.
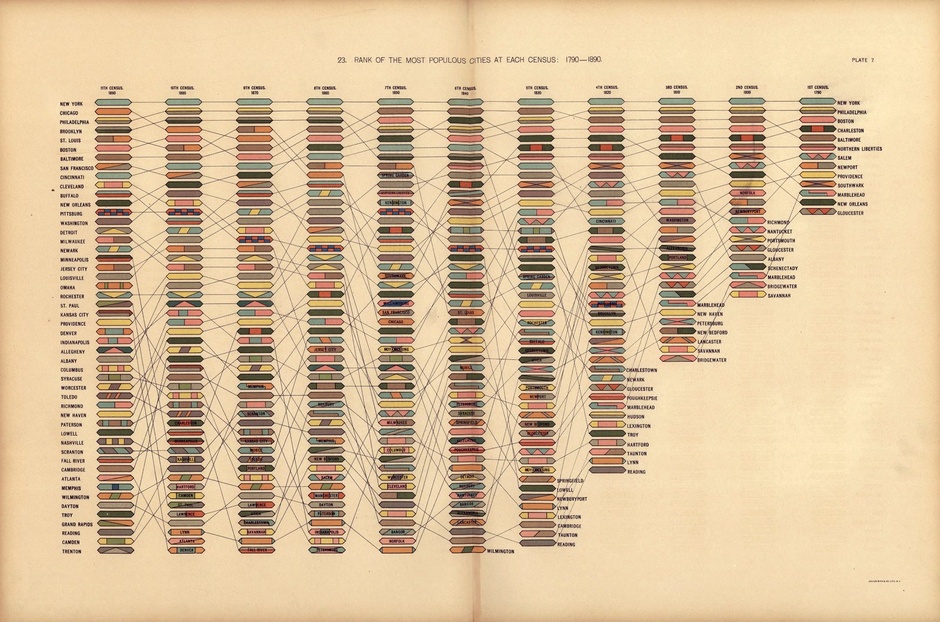
Problem solved, thanks to the info-nerds at Vintage Visualizations, a project of the Brooklyn Brainery. They’ve reproduced a number of the LOC’s Civil War-era data visualizations in high-quality poster prints, and they are mouthwateringly cool. For example, I really wish we still ranked city populations like this chart does, which traces a century of census data in colorful Jenga towers (NYC, forever the biggest apple!):

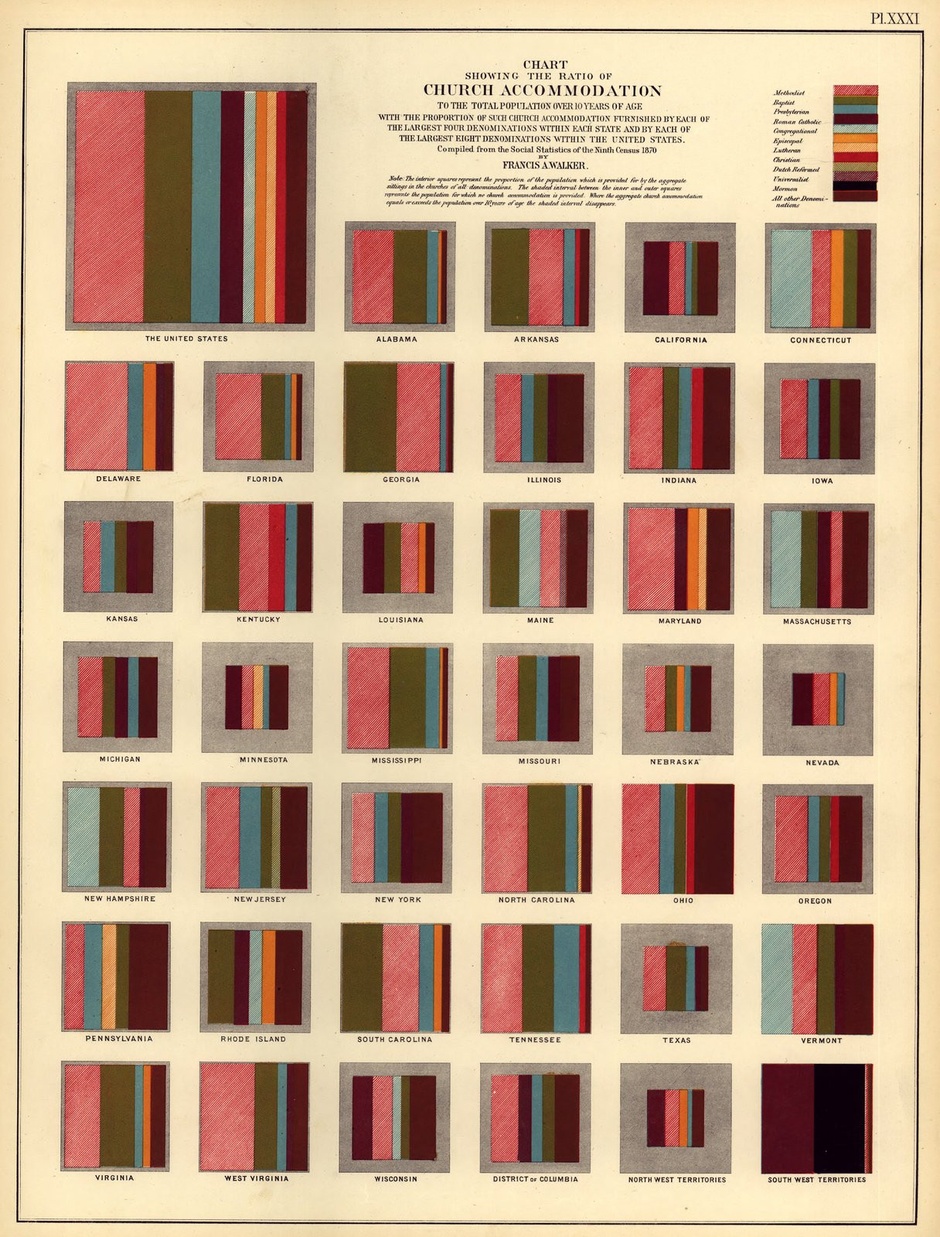
Behold, the ratio of “church accommodation” by state, circa 1870, displayed like wallpaper swatches….(More):
