Cat Drew at Civil Service Quarterly: “…Data and digital are fairly understandable concepts in policy-making. But design? Why is it one of the three Ds?
Policy Lab believes that design approaches are particularly suited to complex issues that have multiple causes and for which there is no one, simple answer. Design encourages people to think about the user’s needs (not just the organisation’s needs), brings in different perspectives to innovate new ideas, and then prototypes (mocks them up and tries them out) to iteratively improve ideas until they find one that can be scaled up.
Policy Lab also recognises that data alone cannot solve policy problems, and has been experimenting with how to combine numerical and more human practices. Data can explain what is happening, while design research methods – such as ethnography, observing people’s behaviours – can explain why things are happening. Data can be used to automate and tailor public services; while design means frontline delivery staff and citizens will actually know about and use them. Data-rich evidence is highly valued by policy-makers; and design can make it understandable and accessible to a wider group of people, opening up policy-making in the process.
The Lab is also experimenting with new data methods.
Data science can be used to look at complex, unstructured data (social media data, for example), in real time. Digital data, such as social media data or internet searches, can reveal how people behave (rather than how they say they behave). It can also look at huge amounts of data far quicker than humans, and find unexpected patterns hidden in the data. Powerful computers can identify trends from historical data and use these to predict what might happen in the future.
Supporting people in work project
The project took a DDD approach to generating insight and then creating ideas. The team (including the data science organisation Mastodon C and design agency Uscreates) used data science techniques together with ethnography to create a rich picture about what was happening. Then it used design methods to create ideas for digital services with the user in mind, and these were prototyped and tested with users.
The data science confirmed many of the known risk factors, but also revealed some new insights. It told us what was happening at scale, and the ethnography explained why.
- The data science showed that people were more likely to go onto sickness benefits if they had been in the job a shorter time. The ethnography explained that the relationship with the line manager and a sense of loyalty were key factors in whether someone stayed in work or went onto benefits.
- The data science showed that women with clinical depression were less likely to go onto sickness benefits than men with the same condition. The ethnography revealed how this played out in real life:
- For example, Ella [not her real name], a teacher from London who had been battling with depression at work for a long time but felt unable to go to her boss about it. She said she was “relieved” when she got cancer, because she could talk to her boss about a physical condition and got time off to deal with both illnesses.
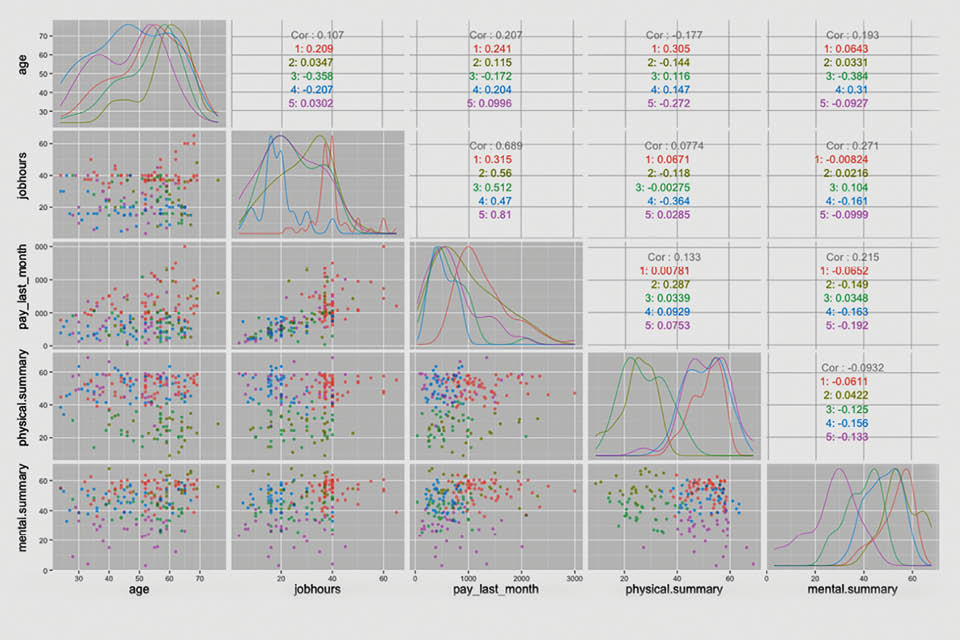
- The data science also allowed the segmentation of groups of people who said they were on health-related benefits. Firstly, the clustering revealed that two groups had average health ratings, indicating that other non-health-related issues might be driving this. Secondly, it showed that these two groups were very different (one older group of men with previously high pay and working hours; the other of much younger men with previously low pay and working hours). The conclusion was that their motivations and needs to stay in work – and policy interventions – would be different.
- The ethnography highlighted other issues that were not captured in the data but would be important in designing solutions, such as: a lack of shared information across the system; the need of the general practitioner (GP) to refer patients to other non-health services as well as providing a fit note; and the importance of coaching, confidence-building and planning….(More)”