Due Diligence? We need an app for that


Ken Banks at kiwanja.net: “The ubiquity of mobile phones, the reach of the Internet, the shear number of problems facing the planet, competitions and challenges galore, pots of money and strong media interest in tech-for-good projects has today created the perfect storm. Not a day goes by without the release of an app hoping to solve something, and the fact so many people are building so many apps to fix so many problems can only be a good thing. Right?

The only problem is this. It’s become impossible to tell good from bad, even real from fake. It’s something of a Wild West out there. So it was no surprise to see this happening recently. Quoting The Guardian:

An app which purported to offer aid to refugees lost in the Mediterranean has been pulled from Apple’s App Store after it was revealed as a fake. The I Sea app, which also won a Bronze medal at the Cannes Lions conference on Monday night, presented itself as a tool to help report refugees lost at sea, using real-time satellite footage to identify boats in trouble and highlighting their location to the Malta-based Migrant Offshore Aid Station (Moas), which would provide help.

In fact, the app did nothing of the sort. Rather than presenting real-time satellite footage – a difficult and expensive task – it instead simply shows a portion of a static, unchanging image. And while it claims to show the weather in the southern Mediterranean, that too isn’t that accurate: it’s for Western Libya.

The worry isn’t only that someone would decide to build a fake app which ‘tackles’ such an emotive subject, but the fact that this particular app won an award and received favourable press. Wired, Mashable, the Evening Standard and Reuters all spoke positively about it. Did no-one check that it did what it said it did?

This whole episode reminds me of something Joel Selanikio wrote in his contributing chapter to two books I’ve recently edited and published. In his chapters, which touch on his work on the Magpi data collection tool in addition to some of the challenges facing the tech-for-development community, Joel wrote:

In going over our user activity logs for the online Magpi app, I quickly realised that no-one from any of our funding organisations was listed. Apparently no-one who was paying us had ever seen our working software! This didn’t seem to make sense. Who would pay for software without ever looking at it? And if our funders hadn’t seen the software, what information were they using when they decided whether to fund us each year?

…The shear number of apps available that claim to solve all manner of problems may seem encouraging on the surface – 1,500 (and counting) to help refugees might be a case in point – but how many are useful? How many are being used? How many solve a problem? And how many are real?

Due diligence? Maybe it’s time we had an app for that…(More)”

Crowdsourcing privacy policy analysis: Potential, challenges and best practices


Paper by , and : “Privacy policies are supposed to provide transparency about a service’s data practices and help consumers make informed choices about which services to entrust with their personal information. In practice, those privacy policies are typically long and complex documents that are largely ignored by consumers. Even for regulators and data protection authorities privacy policies are difficult to assess at scale. Crowdsourcing offers the potential to scale the analysis of privacy policies with microtasks, for instance by assessing how specific data practices are addressed in privacy policies or extracting information about data practices of interest, which can then facilitate further analysis or be provided to users in more effective notice formats. Crowdsourcing the analysis of complex privacy policy documents to non-expert crowdworkers poses particular challenges. We discuss best practices, lessons learned and research challenges for crowdsourcing privacy policy analysis….(More)”

Blurring the Boundaries Through Digital Innovation


Book edited by D’Ascenzo, F., Magni, M., Lazazzara, A., Za, S: “This book examines the impact of digital innovation on organizations. It reveals how the digital revolution is redefining traditional levels of analysis while at the same time blurring the internal and external boundaries of the organizational environment. It presents a collection of research papers that examine the interaction between Information and Communication Technology (ICT) and behavior from a threefold perspective:

First, they analyze individual behavior in terms of specific organizational practices like learning, collaboration and knowledge transfer, as well as the use of ICT within the organization.

Second, they explore the dynamics at work on the border between the internal and the external environments by analyzing the organizational impact of ICT usage outside the company, as can be seen in employer branding, consumer behavior and organizational image.

Third, they investigate how ICT is being adopted to help face societal challenges outside the company like waste and pollution, smart cities, and e-government….(More)”

What determines social behavior? Investigating the role of emotions, self-centered motives, and social norms.


Special issue of Frontiers in Human Neuroscience edited by Corrado Corradi-Dell’AcquaLeonie KobanSusanne Leiberg and Patrik Vuilleumier: “In the last decade, a growing research effort in behavioral sciences, especially psychology and neuroscience, has been invested in the study of the cognitive, biological, and evolutionary foundations of social behavior. Differently from the case of sociology, which studies social behavior also at the group level in terms of organizations and structures, psychology and neuroscience often define “social” as a feature of the individual brain that allows an efficient interaction with conspecifics, and thus constitutes a possible evolutionary advantage (Matusall, 2013). …

In the last decades, psychologist and neuroscientists invested a considerable amount of research to investigate the ability to act “socially”, which is considered an evolutionary advantage of many species (Matusall, 2013). The present Research Topic is a collection of a large number (38) of original contributions from an interdisciplinary community which together highlight that determinants of individual social behavior should be best understood along at least two different dimensions. This general perspective represents the backbone for a comprehensive and articulated model of how people and their brains interact with each other in social contexts. However, despite its appeal, it remains unclear how the model put forward in this editorial relates to particular paradigms with high ecological value, where it is more difficult to neatly disentangle the relative contribution of personal/environmental or stable/transient determinants. This is for instance the case of Preston et al. (2013) who investigated hospitalized terminal patients, measuring the emotional reactions elicited in observers and whether they were related to the frequency with which aid was delivered. In this perspective, a great challenge for future research in social psychology and neuroscience will indeed be to develop more accurate predictive models of social behavior and to make them applicable to ecologically valid settings….(More)”

The Surprising History of the Infographic


Clive Thompson at the Smithsonian magazine: “As the 2016 election approaches, we’re hearing a lot about “red states” and “blue states.” That idiom has become so ingrained that we’ve almost forgotten where it originally came from: a data visualization.

In the 2000 presidential election, the race between Al Gore and George W. Bush was so razor close that broadcasters pored over electoral college maps—which they typically colored red and blue. What’s more, they talked about those shadings. NBC’s Tim Russert wondered aloud how George Bush would “get those remaining 61 electoral red states, if you will,” and that language became lodged in the popular imagination. America became divided into two colors—data spun into pure metaphor. Now Americans even talk routinely about “purple” states, a mental visualization of political information.

We live in an age of data visualization. Go to any news website and you’ll see graphics charting support for the presidential candidates; open your iPhone and the Health app will generate personalized graphs showing how active you’ve been this week, month or year. Sites publish charts showing how the climate is changing, how schools are segregating, how much housework mothers do versus fathers. And newspapers are increasingly finding that readers love “dataviz”: In 2013, the New York Times’ most-read story for the entire year was a visualization of regional accents across the United States. It makes sense. We live in an age of Big Data. If we’re going to understand our complex world, one powerful way is to graph it.

But this isn’t the first time we’ve discovered the pleasures of making information into pictures. Over a hundred years ago, scientists and thinkers found themselves drowning in their own flood of data—and to help understand it, they invented the very idea of infographics.

**********

The idea of visualizing data is old: After all, that’s what a map is—a representation of geographic information—and we’ve had maps for about 8,000 years. But it was rare to graph anything other than geography. Only a few examples exist: Around the 11th century, a now-anonymous scribe created a chart of how the planets moved through the sky. By the 18th century, scientists were warming to the idea of arranging knowledge visually. The British polymath Joseph Priestley produced a “Chart of Biography,” plotting the lives of about 2,000 historical figures on a timeline. A picture, he argued, conveyed the information “with more exactness, and in much less time, than it [would take] by reading.”

Still, data visualization was rare because data was rare. That began to change rapidly in the early 19th century, because countries began to collect—and publish—reams of information about their weather, economic activity and population. “For the first time, you could deal with important social issues with hard facts, if you could find a way to analyze it,” says Michael Friendly, a professor of psychology at York University who studies the history of data visualization. “The age of data really began.”

An early innovator was the Scottish inventor and economist William Playfair. As a teenager he apprenticed to James Watt, the Scottish inventor who perfected the steam engine. Playfair was tasked with drawing up patents, which required him to develop excellent drafting and picture-drawing skills. After he left Watt’s lab, Playfair became interested in economics and convinced that he could use his facility for illustration to make data come alive.

“An average political economist would have certainly been able to produce a table for publication, but not necessarily a graph,” notes Ian Spence, a psychologist at the University of Toronto who’s writing a biography of Playfair. Playfair, who understood both data and art, was perfectly positioned to create this new discipline.

In one famous chart, he plotted the price of wheat in the United Kingdom against the cost of labor. People often complained about the high cost of wheat and thought wages were driving the price up. Playfair’s chart showed this wasn’t true: Wages were rising much more slowly than the cost of the product.

JULAUG2016_H04_COL_Clive.jpg
Playfair’s trade-balance time-series chart, published in his Commercial and Political Atlas, 1786 (Wikipedia)

“He wanted to discover,” Spence notes. “He wanted to find regularities or points of change.” Playfair’s illustrations often look amazingly modern: In one, he drew pie charts—his invention, too—and lines that compared the size of various country’s populations against their tax revenues. Once again, the chart produced a new, crisp analysis: The British paid far higher taxes than citizens of other nations.

Neurology was not yet a robust science, but Playfair seemed to intuit some of its principles. He suspected the brain processed images more readily than words: A picture really was worth a thousand words. “He said things that sound almost like a 20th-century vision researcher,” Spence adds. Data, Playfair wrote, should “speak to the eyes”—because they were “the best judge of proportion, being able to estimate it with more quickness and accuracy than any other of our organs.” A really good data visualization, he argued, “produces form and shape to a number of separate ideas, which are otherwise abstract and unconnected.”

Soon, intellectuals across Europe were using data visualization to grapple with the travails of urbanization, such as crime and disease….(More)”

You can help stop human trafficking with the TraffickCam app


 in TechCrunch: “In a world where the phrase “oh god, not another app” often springs to mind, along with “Yeah, yeah, I’m sure you want to make a world a better place” TraffickCam is a blast of icy-fresh air.

TraffickCam is an app developed by the Exchange Initiative, an organization fighting back against sex trafficking.

The goal of the new app is to build a national database of photos of the insides of hotel rooms to help law enforcement match images posted by sex traffickers to locations, in an effort to map out the routes and methods used by traffickers. The app will also be useful to help locate victims — and the people who put them in their predicament.

Available for both iOS and Android, the app is unlikely to win any design awards, but that isn’t the point; the app makers are solving a tremendous problem and any tools available to help resolve some of this will be welcomed with open arms by the organizations fighting the good fight….

The app, then, is a crowd-sourced data gathering tool which can be used to match known locations to photos confiscated from or shared by the perpetrators. Features such as patterns in the carpeting, furniture, room accessories and window views can be analyzed, and according to the app’s creators, testing shows that the app is 85 percent accurate in identifying the correct hotel in the top 20 matches.

“Law enforcement is always looking for new and innovative ways to recover victims, locate suspects and investigate criminal activity,” said Sergeant Adam Kavanagh, St. Louis County Police Department and Supervisor of the St. Louis County Multi-Jurisdictional Human Trafficking Task Force.

 Today, the organization’s database contains 1.5 million photos from more than 145,000 hotels in every major metropolitan area of the U.S., a combination of photos taken by early users of the TraffickCam smartphone app and from publicly available sources of hotel room images….(More)”

How A Videogame Can Be A Source For Innovation


Jiwon Kim at PSFK: “The nonprofit Games For Change has a mission to utilize games to change the world. More specifically, it’s to facilitate “the creation and distribution of social impact games that serve as critical tools in humanitarian and educational efforts.”….PSFK decided to explore the three finalists up to win the award for the most innovative game of 2016:

1. Life is Strange: This game is comprised of five episodes that allow the gamer to turn back the time and change a chain of events. The gamers follow the protagonist, Maxine, as she uses her power to rewind time to save her friends and her town. This game is innovative in the sense that gamers intimately interact with this intricate plot while exploring important issues such as suicide, substance issues and relationships. The game is like a beautiful animated movie with great music, except the gamer decides the ending.

2. That Dragon, Cancer: The game’s creator, Ryan Green, is a programmer who wanted to share his experience of raising a young son struggling with cancer. The narrative video game retells how Ryan’s son and the rest of his family went on an emotional roller coaster ride that lasted years. Unfortunately, his son passed away but the Green family hopes that this game provides a deep insight into this difficult journey and dealing with feelings of hope and loss. The game brings in a new perspective and a new medium for intimate stories to be shared.

3. Lumino City: This game is entirely handcrafted with paper, miniature lights and motors. Lumino City is a beautiful 10-foot high city that serves as the setting of an exciting adventure. Gamers get to be Lumi, the protagonist, as she goes off on a journey to find her grandfather. Everything about this game is innovative in the sense that the creators fuse the digital world and traditional arts and crafts together….(More).

DARPA wants to design an army of ultimate automated data scientists


Michael Cooney in NetworkWorld: “Because of a plethora of data from sensor networks, Internet of Things devices and big data resources combined with a dearth of data scientists to effectively mold that data, we are leaving many important applications – from intelligence to science and workforce management – on the table.

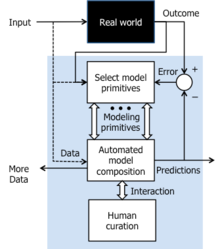
It is a situation the researchers at DARPA want to remedy with a new program called Data-Driven Discovery of Models (D3M). The goal of D3M is to develop algorithms and software to help overcome the data-science expertise gap by facilitating non-experts to construct complex empirical models through automation of large parts of the model-creation process. If successful, researchers using D3M tools will effectively have access to an army of “virtual data scientists,” DARPA stated.

d3mfigureDARPA

This army of virtual data scientists is needed because some experts project deficits of 140,000 to 190,000 data scientists worldwide in 2016 alone, and increasing shortfalls in coming years. Also, because the process to build empirical models is so manual, their relative sophistication and value is often limited, DARPA stated.

“We have an urgent need to develop machine-based modeling for users with no data-science background. We believe it’s possible to automate certain aspects of data science, and specifically to have machines learn from prior example how to construct new models,” said Wade Shen, program manager in DARPA’s Information Innovation Office in a statement….(More)”

Big Data Challenges: Society, Security, Innovation and Ethics


Book edited by Bunnik, A., Cawley, A., Mulqueen, M., Zwitter, A: “This book brings together an impressive range of academic and intelligence professional perspectives to interrogate the social, ethical and security upheavals in a world increasingly driven by data. Written in a clear and accessible style, it offers fresh insights to the deep reaching implications of Big Data for communication, privacy and organisational decision-making. It seeks to demystify developments around Big Data before evaluating their current and likely future implications for areas as diverse as corporate innovation, law enforcement, data science, journalism, and food security. The contributors call for a rethinking of the legal, ethical and philosophical frameworks that inform the responsibilities and behaviours of state, corporate, institutional and individual actors in a more networked, data-centric society. In doing so, the book addresses the real world risks, opportunities and potentialities of Big Data….(More)”

The Perils of Using Technology to Solve Other People’s Problems


Ethan Zuckerman in The Atlantic: “I found Shane Snow’s essay on prison reform — “How Soylent and Oculus Could Fix the Prison System” — through hate-linking….

Some of my hate-linking friends began their eye-rolling about Snow’s article with the title, which references two of Silicon Valley’s most hyped technologies. With the current focus on the U.S. as an “innovation economy,” it’s common to read essays predicting the end of a major social problem due to a technical innovation.Bitcoin will end poverty in the developing world by enabling inexpensive money transfers. Wikipedia and One Laptop Per Child will educate the world’s poor without need for teachers or schools. Self driving cars will obviate public transport and reshape American cities.

The writer Evgeny Morozov has offered a sharp and helpful critique to this mode of thinking, which he calls “solutionism.” Solutionism demands that we focus on problems that have “nice and clean technological solution at our disposal.” In his book, To Save Everything, Click Here, Morozov savages ideas like Snow’s, regardless of whether they are meant as thought experiments or serious policy proposals. (Indeed, one worry I have in writing this essay is taking Snow’s ideas too seriously, as Morozov does with many of the ideas he lambastes in his book.)

The problem with the solutionist critique, though, is that it tends to remove technological innovation from the problem-solver’s toolkit. In fact, technological development is often a key component in solving complex social and political problems, and new technologies can sometimes open a previously intractable problem. The rise of inexpensive solar panels may be an opportunity to move nations away from a dependency on fossil fuels and begin lowering atmospheric levels of carbon dioxide, much as developments in natural gas extraction and transport technologies have lessened the use of dirtier fuels like coal.

But it’s rare that technology provides a robust solution to a social problem by itself. Successful technological approaches to solving social problems usually require changes in laws and norms, as well as market incentives to make change at scale….

Design philosophies like participatory design and codesign bring this concept to the world of technology, demanding that technologies designed for a group of people be designed and built, in part, by those people. Codesign challenges many of the assumptions of engineering, requiring people who are used to working in isolation to build broad teams and to understand that those most qualified to offer a technical solution may be least qualified to identify a need or articulate a design problem. This method is hard and frustrating, but it’s also one of the best ways to ensure that you’re solving the right problem, rather than imposing your preferred solution on a situation…(More)”