Stefaan Verhulst
Jacob Poushter at Pew: “Despite the seeming ubiquity of social media platforms like Facebook and Twitter, many in Europe, the U.S., Canada, Australia and Japan do not report regularly visiting social media sites. But majorities in all of the 14 countries surveyed say they at least use the internet.
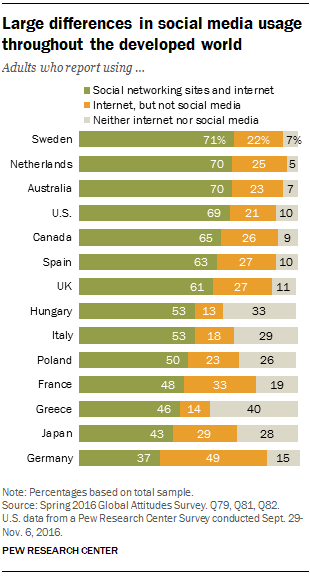 Social media use is relatively common among people in Sweden, the Netherlands, Australia and the U.S. Around seven-in-ten report using social networking sites like Facebook and Twitter, but that still leaves a significant minority of the population in those countries (around 30%) who are non-users.
At the other end of the spectrum, in France, only 48% say they use social networking sites. That figure is even lower in Greece (46%), Japan (43%) and Germany (37%). In Germany, this means that more than half of internet users say they do not use social media.
The differences in reported social media use across the 14 countries are due in part to whether people use the internet, since low rates of internet access limit the potential social media audience. While fewer than one-in-ten Dutch (5%), Swedes (7%) and Australians (7%) don’t access the internet or own a smartphone, that figure is 40% in Greece, 33% in Hungary and 29% in Italy.
However, internet access doesn’t guarantee social media use. In Germany, for example, 85% of adults are online, but less than half of this group report using Facebook, Twitter or Xing. A similar pattern is seen in some of the other developed economies polled, including Japan and France, where social media use is low relative to overall internet penetration….(More)
Priyanka Dutt at BBC Media Action: “Anyone working in international development will attest that human-centred design (HCD) has been a ‘trending topic’ in recent years. Design thinking has been applied to a range of challenges, from supporting democratic transition in Libya to building an all-terrain wheelchair for under $200. Melinda Gates even hailed HCD as the innovation changing the most lives in the developing world.
But what exactly is design thinking? It involves bringing together multi-disciplinary teams – think creative writers working alongside ICT specialists – to address challenges through rapid prototyping and repeated testing. At the core of HCD is building empathy with the people you’re designing for with the overarching aim of producing something genuinely valuable to them.
Marrying these principles with our own core value of putting audiences at the heart of everything we do, we decided to set up a ‘laboratory’ in Bihar, in northern India, which aimed to improve child and maternal health through communication. We saw Bihar as a great site for HCD-style innovation because it offered us the scope to test and fine tune new ways of using communication to promote healthy behaviours for women and children alike.
Bihar is home to 29 million women of reproductive age, who give birth 3 million times every year. And although Bihar’s maternal mortality rate has declined in recent years to 93 per 100,000 live births, it is still well above the Sustainable Development Goals target of 70. As for the communication challenges, less than a fifth of these women watch TV and only 12% listen to the radio.
Yet the lab’s early creations achieved a great deal. Over 50,000 people have graduated from our Mobile Academy training course, which is delivered through mobile phone audio messages. The course teaches health workers how to communicate more effectively to persuade families to lead healthier lives.
We also produced a set of cards and audio messages delivered via mobile phone – called Mobile Kunji – for health workers to use during their visits with families. The evidence shows that families subsequently asked health workers more questions and were more likely to follow advice on preparing for birth, family planning and how to feed babies.
Rethinking strategy: learning from failure
High on our early successes, we set about developing Kilkari (a baby’s gurgle in Hindi). This programme sends weekly audio messages about pregnancy, child birth, and child care, directly to families’ mobile phones, from the second trimester of pregnancy until the child is one year old. The aim was that Kilkari would be listened to across Bihar, by the most vulnerable families, with the greatest need and least access to information and services.
Drawing on lessons from two similar services from around the world, Mobile Midwife and BabyCenter, in addition to our own prior experience in Bihar, we were confident Kilkari would be a success. Just to be certain, we ran some tests before rollout and found that we had failed in our vision – and spectacularly so. We weren’t getting through to our main audience, women, as we weren’t using the right channels and language.
In the end, we went back to the drawing board on Kilkari four times, simplifying and stripping down the content time and again, until we got it right. Through repeated prototype-test-redesign cycles, we made the vitally important discovery that our basic assumptions about our audiences were wrong. So we went back to basics and asked ourselves the following questions to push us to rethink our strategy:
1. Is the content relevant and easy to understand?…
2. Are we getting through to our target audience?…
3. Can we do more to keep our target audience engaged?…(More)”
/AI-Assistant-Pilot: “Welcome to GSA’s Emerging Citizen Technology program’s pilot for the effective, efficient and accountable introduction and benchmark of public service information integration into consumer-available AI Personal Assistants (IPAs) including Amazon Alexa, Google Assistant, Microsoft Cortana, and Facebook Messenger’s chatbot service — and in the process lay a strong foundation for opening our programs to self-service programs in the home, mobile devices, automobiles and further.
This pilot will require rapid development and will result in public service concepts reviewed by the platforms of your choosing, as well as the creation of a new field of shared resources and recommendations that any organization can use to deliver our program data into these emerging services.
Principles
The demand for more automated, self-service access to United States public services, when and where citizens need them, grows each day—and so do advances in the consumer technologies like Intelligent Personal Assistants designed to meet those challenges.
The U.S. General Services Administration’s (GSA) Emerging Citizen Technology program, part of the Technology Transformation Service’s Innovation Portfolio, launched an open-sourced pilot to guide dozens of federal programs make public service information available to consumer Intelligent Personal Assistants (IPAs) for the home and office, such as Amazon Alexa, Microsoft Cortana, Google Assistant, and Facebook Messenger.
These same services that help power our homes today will empower the self-driving cars of tomorrow, fuel the Internet of Things, and more. As such, the Emerging Citizen Technology program is working with federal agencies to prepare a solid understanding of the business cases and impact of these advances.
From privacy, security, accessibility, and performance to how citizens can benefit from more efficient and open access to federal services, the program is working with federal agencies to consider all aspects of its implementation. Additionally, by sharing openly with private-sector innovators, small businesses, and new entries into the field, the tech industry will gain increased transparency into working with the federal government….(More)”.
Nathaniel Persily in the Journal of Democracy: “…The actual story of the 2016 digital campaign is, of course, quite different, and we are only beginning to come to grips with what it might mean for campaigns going forward. Whereas the stories of the last two campaigns focused on the use of new tools, most of the 2016 story revolves around the online explosion of campaign-relevant communication from all corners of cyberspace. Fake news, social-media bots (automated accounts that can exist on all types of platforms), and propaganda from inside and outside the United States—alongside revolutionary uses of new media by the winning campaign—combined to upset established paradigms of how to run for president.
Indeed, the 2016 campaign broke down all the established distinctions that observers had used to describe campaigns: between insiders and outsiders, earned media and advertising, media and nonmedia, legacy media and new media, news and entertainment, and even foreign and domestic sources of campaign communication. How does one characterize a campaign, for example, in which the chief strategist is also the chairman of a media website (Breitbart) that is the campaign’s chief promoter and whose articles the candidate retweets to tens of millions of his followers, with those tweets then picked up and rebroadcast on cable-television news channels, including one (RT, formerly known as Russia Today) that is funded by a foreign government?
The 2016 election represents the latest chapter in the disintegration of the legacy institutions that had set bounds for U.S. politics in the postwar era. It is tempting (and in many ways correct) to view the Donald Trump campaign as unprecedented in its breaking of established norms of politics. Yet this type of campaign could only be successful because established institutions—especially the mainstream media and politicalparty organizations—had already lost most of their power, both in the United States and around the world….(More)”
Ladislav Kristoufek, Helen Susannah Moat and Tobias Preis in EPJ Data Science: “Data on the number of people who have committed suicide tends to be reported with a substantial time lag of around two years. We examine whether online activity measured by Google searches can help us improve estimates of the number of suicide occurrences in England before official figures are released. Specifically, we analyse how data on the number of Google searches for the terms ‘depression’ and ‘suicide’ relate to the number of suicides between 2004 and 2013. We find that estimates drawing on Google data are significantly better than estimates using previous suicide data alone. We show that a greater number of searches for the term ‘depression’ is related to fewer suicides, whereas a greater number of searches for the term ‘suicide’ is related to more suicides. Data on suicide related search behaviour can be used to improve current estimates of the number of suicide occurrences….(More)”
Paper by Benjamin Y. Clark and Jeffrey L. Brudney: “The attention on coproduction and specifically technology-enabled coproduction has grown substantially. This attention had provided findings that highlight the benefits for citizens and governments. Previous research on technologically-enabled coproduction (Internet, smartphones, and centralized non-emergency municipal call centers), show that these technologies have brought coproduction within reach of citizens (Meijer 2011; Kim and Lee 2012; Norris and Reddick 2013; Clark, Brudney, and Jang 2013; Linders 2012; Clark et al. 2016; Clark and Shurik 2016) and have the potential to improve perceptions of government performance (Clark and Shurik 2016). The advent of technologically-enabled coproduction has also made it possible for some residents to participate at levels not previously possible. These high volume coproducers, now known as “frequent flyers,” have the potential to become pseudo-bureaucrats. This chapter seeks to understand if we need to be concerned about this development. Additionally, we seek to understand what individual & neighborhood characteristics affect the intensity of coproduction of public services and if there are diffusion effects of frequent flyers.
To address these questions, we use surveys of San Francisco, California, residents conducted in 2011, 2013, and 2015. Our results suggest that the frequent flyers are largely representative of their communities. Our study finds some evidence that racial and ethnic minorities might be more likely to be a part of this group than the white majority. And perhaps most interestingly we find that neighbors appear to be learning from one another — the more frequent flyers that live in a neighborhood, the more likely it is that you are going to be a frequent flyer….(More)”
Piret Tõnurist at the Observatory of Public Sector Innovation: “The draft report “Wo rking with Change: Systems Approaches to Public Sector Challenges” is now available online. In addition to the framework that was introduced previously on Hackpad, the team working on systems thinking at the Observatory has added four in-depth case studies from Canada, Finland, Iceland and the Netherlands to the analysis. The empirical cases show that systems change in the public sector is possible; moreover, that it can work in diverse settings: child protection in the Netherlands, responding to domestic violence in Iceland, engaging with the sharing economy in Canada, and in experimental policy design in Finland. The final version of the report is expected in June 2017. (Download the draft report here).
Michelle Marshall at the Inter-American Development Bank: “The challenges faced in the development and public policy arenas are often complex in nature. Devising relevant, practical, and innovative solutions requires intensive research, analysis and expertise from multiple sectors. Could there be a way to streamline this process and also make it more inclusive?
Collaborative Design, like other open innovation methodologies, leverages the power of a group for collective problem-solving. In particular, it is a process that virtually convenes a diverse group of specialists to support the iterative development of an intervention.
Last year, the Inter-American Development Bank and the New York University’s Governance Lab hosted an initiative called “Smarter Crowdsourcing for Zika“, which brought together health specialists with experts in social media, predictive analytics, and water and sanitation during a series of online sessions to generate innovative responses to the Zika epidemic. Based on this experience, we have considered how to continue applying a similar collaboration-based approach to additional projects in different areas. The result is what we call a “Collaborative Design” approach.
Implementing a Collaborative Design approach along the course of a project can help to achieve the following:
As promising ideas are identified, Collaborative Design requires documenting possible solutions within the framework of an implementation plan, protocol, or other actionable guideline to support their subsequent real-life application. This will help substantiate the most viable interventions that were previously unmapped and also prepare additional practical resources for other project teams in the future.
For instance, the results of the Zika Smarter Crowdsourcing initiative were structured with information related to the costs and timelines to facilitate their implementation in different local contexts….(More)”
Hollie Russon Gilman at the Stanford Social Innovation Review: “Since the 2016 US presidential election, everyone—including the President and those protesting outside his office—has been talking about bringing the voices of everyday citizens into public life. Several hurdles have prevented the efforts of many groups—including nationwide organizations, civic technologists, social entrepreneurs, policymakers, and advocates championing civic innovation—from reaching and supporting communities that are already engaging citizens in effective ways. These include but are not limited to:
- The challenge of taking local interventions to national politics
- Overreliance on data-driven mechanisms versus community-based solutions
- A lack of definition of political participation beyond elections
Through many disparate efforts runs a persistent question: Where are these citizens? Where, precisely, are people congregating in public life in 2017 America?
One challenge to engaging community residents in civic life beyond simply voting every two or four years is that there is no consensus about what a more robust, participatory model of democracy—one in which people more actively participate in the civic fabric of their community—looks like in the United States. As Harvard Kennedy School Professor Archon Fung noted in an article:
The lack of any background agreement, or even common orientation, on even basic questions about public participation makes the job of those who champion participatory innovation much more difficult. … There would be much more friction and unevenness in elections in the United States if, every two years, supporters of representative democracy had to convince people in every community across the country why voting is desirable and explain how to conduct elections.
For many scholars and practitioners, the answer to where citizens are congregating is a bit of a riddle: Civic life takes place both everywhere and nowhere specific—it is in cities, towns, and communities all across the country, but there is no single center of gravity. That poses challenges for those who wish to mobilize nationwide efforts and who recognize that citizens have finite time. But beneath these challenges, there is also an opportunity to look with fresh eyes on what is already working, and find ways to build on it and bring it to scale.
Below are three models that have the potential to counter these obstacles and scale across communities. It is important to note, however, that unlike getting a product to market, scale in civic engagement does not always mean working on a national level. Efforts should measure civic engagement “return on investment” not just by the number of people reached, but also by the efficacy, equity, and inclusivity of the activity….(More).
Book by Robin Wagner-Pacifici: “We live in a world of breaking news, where at almost any moment our everyday routine can be interrupted by a faraway event. Events are central to the way that individuals and societies experience life. Even life’s inevitable moments—birth, death, love, and war—are almost always a surprise. Inspired by the cataclysmic events of September 11, Robin Wagner-Pacifici presents here a tour de force, an analysis of how events erupt and take off from the ground of ongoing, everyday life, and how they then move across time and landscape.
What Is an Event? ranges across several disciplines, systematically analyzing the ways that events emerge, take shape, gain momentum, flow, and even get bogged down. As an exploration of how events are constructed out of ruptures, it provides a mechanism for understanding eventful forms and flows, from the micro-level of individual life events to the macro-level of historical revolutions, contemporary terrorist attacks, and financial crises. Wagner-Pacifici takes a close look at a number of cases, both real and imagined, through the reports, personal narratives, paintings, iconic images, political posters, sculptures, and novels they generate and through which they live on. What is ultimately at stake for individuals and societies in events, Wagner-Pacifici argues, are identities, loyalties, social relationships, and our very experiences of time and space. What Is an Event? provides a way for us all—as social and political beings living through events, and as analysts reflecting upon them—to better understand what is at stake in the formations and flows of the events that mark and shape our lives….(More)”