Stefaan Verhulst
Across Africa, however, projects are being launched that could revolutionise medical supply chains and commercial deliveries, combat poaching and provide other solutions for an overburdened, underdeveloped continent.
In Rwanda, as in many other African countries, the rainy season makes already difficult roads between smaller towns and villages all but impassable. Battered trucks struggle through the mud, and in some cases even more agile motorbikes and foot traffic are unable get through.
“Rwanda is essentially a rural country. Lots of blood products cannot be stocked at every health centre. At best it can take four to six hours to get supplies through,” says the technology minister, Jean Philbert Nsengimana.
“For mothers giving birth, postpartum haemorrhaging, or bleeding post-delivery, happens quite often. It may not be possible to prevent. Then what is needed is a quick and rapid intervention.”
“This technology has the potential to erase barriers to access for countless critical medicines and save lives on a scale not previously possible,” says Keller Rinaudo, Zipline’s chief executive, which is staffed by experienced aerospace engineers including those who have worked at SpaceX, Boeing and Nasa.
“While there are a number of potential applications for this technology, we’re keenly focused on using it to save lives.”…
Drones are being tested in other emerging economies. Matternet, another Silicon Valley startup, has run pilots moving samples from rural clinics to a laboratory inPapua New Guinea and is launching a small medical delivery network inDominican Republic.
The company is also working with Unicef in Malawi to develop a project using UAVs to carry blood samples from infants born to HIV-positive parents, underscoring the physical and geographical challenges that are present across much of the continent.
Some frontline health workers are supportive….(More)”
Vanessa Kirsch, Jim Bildner and Jeff Walker at Harvard Business Review: “…Over almost two decades, the social enterprise space has been learning how direct impact and systems change work together. The work our entrepreneurs face today is more complex than ever and requires a set of tools and a framework designed to address the complexity inherent when innovations are integrated into existing systems like school districts, welfare agencies, health departments, and corporate structures.
These insights, and the fact that so many of our systemic social challenges remain intractable, has led us to try to better understand what critical levers need to be “pulled” when entrepreneurs are trying to change systems.
The trail to this new approach has been blazed by many extraordinary leaders, some of whom we have funded. These leaders evidence five key characteristics to their approach:
Systems thinking. An individual or organization must first be able to put forward a new solution or set of solutions to a pressing social challenge. This sounds obvious, but we’re suggesting that organizational theories of change, business plans, and other foundational materials need to reflect systems thinking. The most important tool in the new systems entrepreneur’s suite is the ability to embed the solution into the larger system being targeted…
Research and analysis. Beyond technical understanding of solution X and its application to problem Y, systems entrepreneurs must have a deep understanding of the system or systems they are trying to change and all the factors that shape it. Marwell developed an early “influencer map” that gave him a clear understanding of the players, from the federal government to industry and communities, he would need to engage as partners. He also developed a national diagnostic website called SchoolSpeedTest to create a bigger body of data about the problem of limited internet access, with the support of the Federal Communications Commission and 100 other organizations from across sectors.
Communications. Maintaining transparent and compelling communications both internally among collaborative stakeholders and externally with key audiences is crucial to the success of a systems change effort. Marwell knew that he would need to raise awareness of the problem in order to drive through his solution, so he launched a public awareness campaign around broadband access. So Marwell gathered a list of 50 CEOs – Republicans and Democrats alike – to write the FCC, and organized letters from governors, mayors, and education-technology leaders.
Policy. As difficult as it may be to achieve in the politically polarized time we live in, changing policy is often absolutely critical to changing the underlying system that constrains the social change required. Marwell saw this opportunity early on, and he set his sights on updating the Telecommunications Act of 1996’s “E-Rate” discounted pricing provision, which had been wildly successful bringing internet access to 99% of public schools and libraries, but hadn’t kept pace with internet advances. He leveraged his network and was able to start building his case for change in meetings with FCC and White House officials.
Measurement and evaluation. Distinct from the place-setting research and analysis mentioned above, measurement and evaluation is about creating consistent and ongoing data to guide strategy and increase accountability….(More)”
About: “Scholarpedia is a peer-reviewed open-access encyclopedia written and maintained by scholarly experts from around the world. Scholarpediais inspired by Wikipedia and aims to complement it by providing in-depth scholarly treatments of academic topics.
Scholarpedia and Wikipedia are alike in many respects:
- both allow anyone to propose revisions to almost any article
- both are “wikis” and use the familiar MediaWiki software designed for Wikipedia
- both allow considerable freedom within each article’s “Talk” pages
- both are committed to the goal of making the world’s knowledge freely available to all
Nonetheless, Scholarpedia is best understood by how it is unlike most wikis, differences arising from Scholarpedia’s academic origins, goals, and audience. The most significant isScholarpedia’s process of peer-reviewed publication: all articles in Scholarpedia are either in the process of being written by a team of authors, or have already been published and are subject to expert curation….(More)”
Gartner: “This Hype Cycle helps government agencies eager to embrace digital transformation by highlighting critical technologies that can be adopted quickly.
What You Need to Know
Austerity continues to impact governments, and the requirement to transform is substantial. Years of cuts have left IT departments struggling to operate bimodally, focused on maintaining operations, but not delivering innovation. Effective and efficient mission delivery necessitates more technology, not less, so senior organizational leaders look outside the IT department to source innovation and additional capacity. Digital government demands improvements in the value chain, using end-to-end frictionless transactions, as the outcome of technical and process improvement. CIOs’ focus must move from infrastructure and its costs toward quickly delivering true mission outcome improvements.
This Hype Cycle highlights technologies that government CIOs should be implementing or planning for to ensure the organization obtains the necessary, impactful capabilities to deliver the digital government agenda quickly. To maintain their own relevance, government CIOs must recognize their organizations’ need for innovation and be mindful of the top trends and technologies disrupting their organizations.
The Hype Cycle
This Hype Cycle addresses all geographies and tiers of government tackling the opportunities presented by digital disruptions. The technologies herein support digital government and the global trends identified in“The Top 10 Strategic Technology Trends for Government in 2016.” These technologies align to one or more of the trends and offer a mix of benefits, from increased effectiveness and efficiency, to improved security and enhanced customer interaction. Our intention is to draw attention to those technologies that map directly to these trends, and their inclusion is explained in the section “Off the Hype Cycle.”
Slower economic growth, higher debt, rising citizen expectations and an aging population demand innovative delivery of citizen-facing services, so the ROI to support investment in these technologies must be measured in more-effective outcomes. Agencies crave new solutions and capabilities to help ease the pressure on them, and they think that, if not delivered by their incumbent IT provider, they will increasingly source directly.
The technologies selected provide practical and pragmatic choices for those CIOs who need to deliver strategic solutions to enhance organizational capabilities. Use Cloud Office and Enterprise File Synchronization and Sharing (EFSS) to deliver a better digital workplace experience, or make better use of open data by using data quality tools, API marketplaces, and geospatial and location intelligence tools. We also offer a glimpse of the future to provide a better understanding of how smart machines, such as Smart Robots or Cognitive Expert Advisors, will impact your agency. In either case, using the technologies highlighted here and using Strategic Technology Maps to assess what priority and when you might be able to move will assist the business in knowing when functionality will become available. This knowledge may inspire the use of commercially available capabilities and forgo the desire for customers to self-source solutions.

Source: Gartner (July 2016)
The Priority Matrix
The Priority Matrix shows those technologies and the time frame by which they are expected to mature and deliver benefits. Transformational and high benefits accrue immediately and run forward, delivering across the next decade. It is no surprise seeing that immediate benefits accrue to tactical investment technologies, such as Social Media Engagement Applications. They allow government agencies to go beyond monitoring citizen satisfaction by giving them a level of analysis and allowing them to engage in an informed two-way debate. Thus, multichannel citizen engagement can become a measured reality, taking government out to where the citizens communicate. This is supported by customer engagement hubs that allow personalized, contextual engagement with customers across all interaction channels, regardless of medium.
Smart Machines and the Internet of Things (IoT) are also featured this year, with real examples of technologies to help smart cities progress, with the inclusion of smart transportation solutions and an IOT platform that can help government agencies deal with the plethora of data sources that will undoubtedly emerge. It must be noted, these technologies operate as digital platforms, per se. “Implementing once, serving many” must become a mantra for digital government if it is to succeed at being both effective and efficient.
Figure 2. Priority Matrix for Digital Government, 2016

Source: Gartner (July 2016)…(More).”
Grace Dobush in Quartz: “Taking a bus in Latin America can be a disorienting experience. Whilethe light rail systems in places like Mexico City, Buenos Aires, and Riode Janeiro have system maps that are fairly easy to understand, mostcities lack a comprehensive bus map.
Several factors have kept bus maps from taking root in much of LatinAmerica. One reason is that bus lines running through cities tend to beoperated by a collection of private companies, so they have lessincentive to coordinate. Newspapers and local governmentsoccasionally attempt to create system maps, but none have stuck.
In Managua, Nicaragua, this absence has had a constricting effect onresidents’ lives. Most people know the bus lines that take them toschool or to work, but don’t stray far from their usual route. “Mobilityin Managua is very difficult,” says Felix Delattre, a German programmerand amateur cartographer who moved to Nicaragua 10 years ago towork for an NGO. “People don’t go out at night because they don’t havethe information on when the bus is coming and where it’s going.”
Delattre led a group of volunteers who teamed up with universitystudents in Managua to create what they believe to be the firstcomprehensive bus map in Latin America. The mapping venture is anindependent project connected to the Humanitarian OpenStreetMapTeam, a nonprofit group that uses open-source technology andcrowdsourcing to create badly needed maps around the world. The teamspent almost two years mapping out Managua and Ciudad Sandino andrecording its 46 bus routes….(More)
Lena Groeger at ProPublica: “We’ve seen how design can keep us away from harm and save our lives. But there is a more subtle way that design influences our daily decisions and behavior – whether we know it or not. It’s not sexy or trendy or flashy in any way. I’m talking about defaults.
Defaults are the settings that come out of the box, the selections you make on your computer by hitting enter, the assumptions that people make unless you object, the options easily available to you because you haven’t changed them.
They might not seem like much, but defaults (and their designers) hold immense power – they make decisions for us that we’re not even aware of making. Consider the fact that most people never change the factory settings on their computer, the default ringtone on their phones, or the default temperature in their fridge. Someone, somewhere, decided what those defaults should be – and it probably wasn’t you.
Another example: In the U.S. when you register for your driver’s license, you’re asked whether or not you’d like to be an organ donor. We operate on an opt-in basis: that is, the default is that you are not an organ donor. If you want to donate your organs, you need to actively check a box on the DMV questionnaire. Only about 40 percent of the population is signed up to be an organ donor.
In other countries such as Spain, Portugal and Austria, the default is that you’re an organ donor unless you explicitly choose not to be. And in many of those countries over 99 percent of the population is registered. A recent study found that countries with opt-out or “presumed consent” policies don’t just have more people who sign up to be donors, they also have consistently higher numbers of transplants.
Of course, there are plenty of other factors that influence the success of organ donation systems, but the opt-in versus opt-out choice seems to have a real effect on our collective behavior. An effect that could potentially make the difference between someone getting a life-saving transplant or not.
Behavioral economist Richard Thaler and legal scholar Cass Sunstein pretty much wrote the book on the implications of defaults on human behavior. Nudge: Improving Decisions About Health, Wealth, and Happiness is full of ways in which default options can steer human choices, even if we have no idea it’s happening. Besides organ donation, the list of potential “nudges” include everything from changing the order of menu itemsto encourage people to pick certain dishes to changing the default temperature of office thermostats to save on energy.
But my favorite has to do with getting kids to eat their vegetables.
What if I told you there was one simple change you could make in a school cafeteria to get children to eat more salad? It doesn’t cost anything, force anyone to eat anything they don’t want, and it takes only a few minutes to fix. And it happened in real life: a middle school in New York moved their salad bar away from its default location against a walland put it smack in the middle of the room (and prominently in front of the two cash registers, as seen in the diagram below). Salad sales more than tripled….(More)”
Rose Eveleth at Motherboard: “For centuries judges have had to make guesses about the people in front of them.Will this person commit a crime again? Or is this punishment enough to deter them?Do they have the support they need at home to stay safe and healthy and away from crime? Or will they be thrust back into a situation that drives them to their old ways? Ultimately, judges have to guess.
But recently, judges in states including California and Florida have been given a new piece of information to aid in that guess work: a “risk assessment score” determined by an algorithm. These algorithms take a whole suite of variables into account, and spit out a number (usually between 1 and 10) that estimates the risk that the person in question will wind up back in jail.
If you’ve read this column before, you probably know where this is going. Algorithms aren’t unbiased, and a recent ProPublica investigation suggests what researchers have long been worried about: that these algorithms might contain latent racial prejudice. According to ProPublica’s evaluation of a particular scoring method called the COMPAS system, which was created by a company called Northpointe, people of color are more likely to get higher scores than white people for essentially the same crimes.
Bias against folks of color isn’t a new phenomenon in the judicial system. (This might be the understatement of the year.) There’s a huge body of research that shows that judges, like all humans, are biased. Plenty of studies have shown that for the same crime, judges are more likely to sentence a black person more harshly than a white person. It’s important to question biases of all kinds, both human and algorithmic, but it’s also important to question them in relation to one another. And nobody has done that.
I’ve been doing some research of my own into these recidivism algorithms, and whenI read the ProPublica story, I came out with the same question I’ve had since I started looking into this: these algorithms are likely biased against people of color. But so are judges. So how do they compare? How does the bias present in humans stack up against the bias programmed into algorithms?
This shouldn’t be hard to find out: ideally you would divide judges in a single county in half, and give one half access to a scoring system, and have the other half carry on as usual. If you don’t want to A/B test within a county—and there are some questions about whether that’s an ethical thing to do—then simply compare two counties with similar crime rates, in which one county uses rating systems and the other doesn’t. In either case, it’s essential to test whether these algorithmic recidivism scores exacerbate, reduce, or otherwise change existing bias.
Most of the stories I’ve read about these sentencing algorithms don’t mention any such studies. But I assumed that they existed, they just didn’t make the cut in editing.
I was wrong. As far as I can find, and according to everybody I’ve talked to in the field,nobody has done this work, or anything like it. These scores are being used by judges to help them sentence defendants and nobody knows whether the scores exacerbate existing racial bias or not….(More)”
Bradley J. Fikes in the San Diego Union Tribune: “The modern era’s dramatic advances in medical care relies on more than scientists, doctors and biomedical companies. None of it could come to fruition without patients willing to risk trying experimental therapies to see if they are safe and effective.
More than 220,000 clinical trials are taking place worldwide, with more than 81,000 of them in the United States, according to the federal government’s registry, clinicaltrials.gov. That poses a huge challenge for recruitment.
Companies are offering a variety of inducements to coax patients into taking part. Some rely on that good old standby, cash. Others remove obstacles. Axovant Sciences, which is preparing to test an Alzheimer’s drug, is offering patients transportation from the ridesharing service Lyft.
In addition, non-cash rewards such as iPads, opt-out enrollment in low-risk trials or even guaranteeing patients they will be informed about the clinical trial results should be considered, say a group of researchers who suggest testing these incentives scientifically.
In an article published Wednesday in Science Translational Medicine, the researchers present a matrix of these options, their benefits, and potential drawbacks. They urge companies to track the outcomes of these incentives to find out what works best.
The goal, the article states, is to “nudge” patients into participating, but not so far as to turn the nudge into a coercive shove. Go to j.mp/nudgeclin for the article.
For a nudge, the researchers suggest the wording of a consent form could include options such as a choice of preferred appointment times, such as “Yes, morning appointments,” with a number of similarly worded statements. That wording would “imply that enrollment is normative,” or customary, the article stated.
Researchers could go so far as to vary the offers to patients in a single clinical trial and measure which incentives produce the best responses, said Eric M. Van Epps, one of the researchers. In effect, that would provide a clinical trial of clinical trial incentives.
As part of that tracking, companies need to gain insight into why some patients are reluctant to take part, and those reasons vary, said Van Epps, of the Michael J. Crescenz Veterans Affairs Medical Center in Philadelphia.
“Sometimes they’re not made aware of the clinical trials, they might not understand how clinical trials work, they might want more control over their medication regimen or how they’re going to proceed,” Van Epps said.
At other times, patients may be overwhelmed by the volume of paperwork required. Some paperwork is necessary for legal and ethical reasons. Patients must be informed about the trial’s purpose, how it might help them, and what harm might happen. However, it could be possible to simplify the informed consent paperwork to make it more understandable and less intimidating….(More)”
Jo Ingold and Mark Monaghan at the LSE Politics and Policy Blog: “It’s fair to say that research has never monopolised the policy process to the extent that policies are formulated solely, or even primarily, upon evidence. At the same time, research is never entirely absent from the process nor is it always exploited to justify a pre-existing policy stance as those who pronounce that we that we are now in an era of policy based evidence would have us believe. Often the reality lies somewhere in the middle. A number of studies have looked at how evidence may or may not have impacted on the policy decision-making process. Learning from other contexts, or ‘policy transfer’ is one other way of harnessing particular kinds of evidence, focusing on the migration of policies from one jurisdiction to another, whether within or across countries. Studies have begun to move away from theories of direct transfer to consider the processes involved in movement of ideas from one area to another. In effect, they consider the ‘translation’ of evidence and policy.
Our research brings together the evidence-based policymaking and ‘policy as translation’ literatures to try to shed light on the process by which evidence is used in policymaking. Although these literatures have developed separately (and to a large extent remain so) we see both as, at root, being concerned with the same issues, in particular how ideas, evidence and knowledge are integrated into the policymaking process. With EBPM there is a stated desire to formulate policies based on the best available evidence, while ‘policy as translation’ focuses on the ‘travel of ideas’ and views the policy process as fluid, dynamic and continually re-constituting, rather than a linear or rational ‘transfer’ process….
The Evidence Translation Model is intended to be recursive and includes five key dimensions which influence how evidence, ideas and knowledge are used in policy:
- The substantive nature of the policy problem in the context of the Zeitgeist
- Agenda-setting – where evidence is sought (fishing/farming) and what evidence is used
- The filtration processes which shape and mould how evidence is used (flak/strain)
- The policy apparatus for policy design and implementation
- The role of ‘evidence translators’
Evidence Translation Model
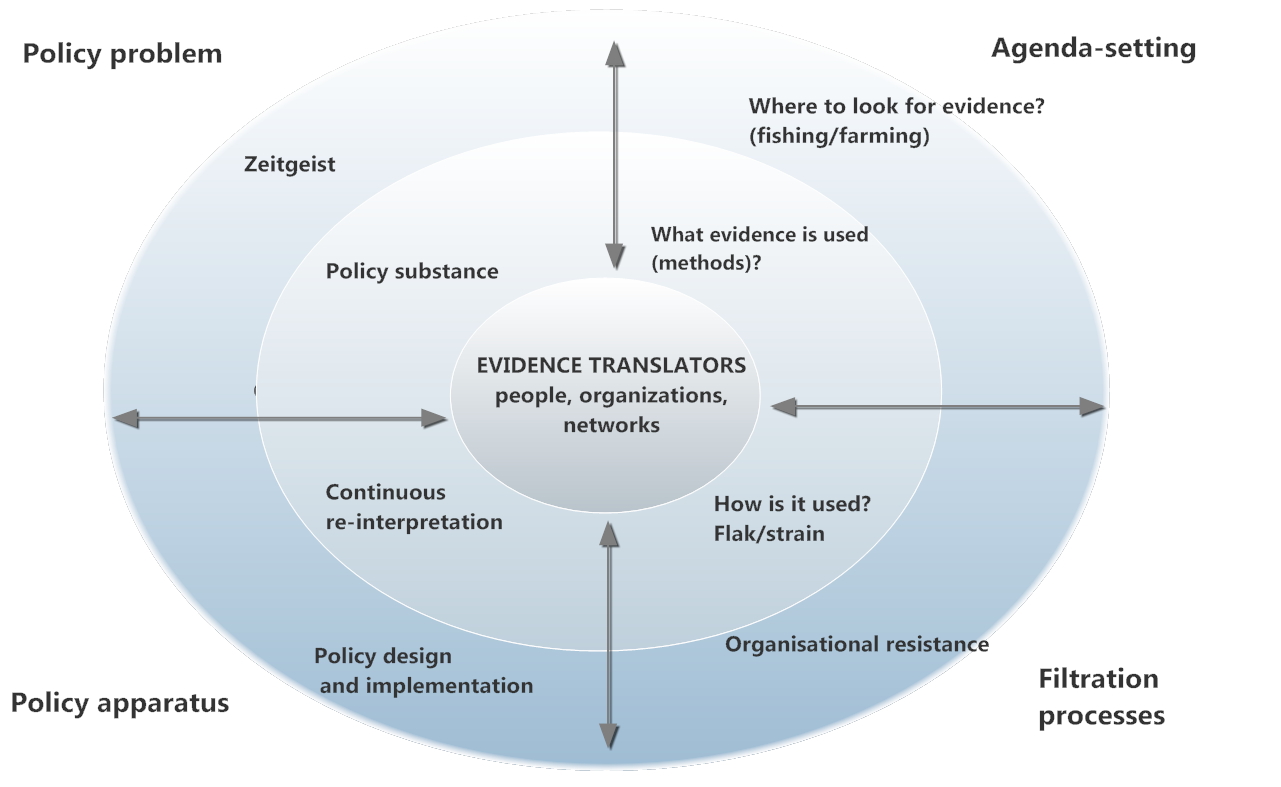
Source: Policy & Politics 2016 (44:2)
Our research draws attention to what is perceived to be evidence and at what stage of the policymaking process it is used….(More; See also authors’ article in Policy & Politics)”.
Tom Symons at NESTA: “How data can help councils provide more personalised, effective and efficient services.
Key findings
- After years of hype and little delivery, councils are now using big and small data in a range of innovative ways to improve decision making and inform public service transformation.
- Emerging trends in the use of data include predictive algorithms, mass data integration across the public sector, open data and smart cities.
- We identify seven ways in which councils can get more value from the data they hold.
What does the data revolution mean for councils and local public services? Local government collects huge amounts of data, about everything from waste collection to procurement processes to care services for some of the most vulnerable people in society. By using council data better, is there potential to make these services more personalised, more effective and more efficient?
Nesta’s Local Datavores research programme aims to answer this question. Where, how and to what extent can better data use can help councils to achieve their strategic objectives? This report is the first in a series, aimed primarily at helping local public sector staff, from senior commissioners through to frontline professionals, get more value from the data they hold….(More)”-