If big data is an atomic bomb, disarmament begins in Silicon Valley


at GigaOM: “Big data is like atomic energy, according to scientist Albert-László Barabási in a Monday column on Politico. It’s very beneficial when used ethically, and downright destructive when turned into a weapon. He argues scientists can help resolve the damage done by government spying by embracing the principles of nuclear nonproliferation that helped bring an end to Cold War fears and distrust.
Barabási’s analogy is rather poetic:

“Powered by the right type of Big Data, data mining is a weapon. It can be just as harmful, with long-term toxicity, as an atomic bomb. It poisons trust, straining everything from human relations to political alliances and free trade. It may target combatants, but it cannot succeed without sifting through billions of data points scraped from innocent civilians. And when it is a weapon, it should be treated like a weapon.”

I think he’s right, but I think the fight to disarm the big data bomb begins in places like Silicon Valley and Madison Avenue. And it’s not just scientists; all citizens should have a role…
I write about big data and data mining for a living, and I think the underlying technologies and techniques are incredibly valuable, even if the applications aren’t always ideal. On the one hand, advances in machine learning from companies such as Google and Microsoft are fantastic. On the other hand, Facebook’s newly expanded Graph Search makes Europe’s proposed right-to-be-forgotten laws seem a lot more sensible.
But it’s all within the bounds of our user agreements and beauty is in the eye of the beholder.
Perhaps the reason we don’t vote with our feet by moving to web platforms that embrace privacy, even though we suspect it’s being violated, is that we really don’t know what privacy means. Instead of regulating what companies can and can’t do, perhaps lawmakers can mandate a degree of transparency that actually lets users understand how data is being used, not just what data is being collected. Great, some company knows my age, race, ZIP code and web history: What I really need to know is how it’s using that information to target, discriminate against or otherwise serve me.
An intelligent national discussion about the role of the NSA is probably in order. For all anyone knows,  it could even turn out we’re willing to put up with more snooping than the goverment might expect. But until we get a handle on privacy from the companies we choose to do business with, I don’t think most Americans have the stomach for such a difficult fight.”

More Top-Down Participation, Please! Institutionalized empowerment through open participation


Michelle Ruesch and Oliver Märker in DDD: “…this is not another article on the empowering potential of bottom-up digital political participation. Quite the contrary: It instead seeks to stress the empowering potential of top-down digital political participation. Strikingly, the democratic institutionalization of (digital) political participation is rarely considered when we speak about power in the context of political participation. Wouldn’t it be true empowerment though if the right of citizens to speak their minds were directly integrated into political and administrative decision-making processes?

Institutionalized political participation

Political participation, defined as any act that aims to influence politics in some way, can be initiated either by citizens, referred to as “bottom-up” participation, or by government, often referred to as “top-down” participation.  For many, the word “top-down” instantly evokes negative connotations, even though top-down participatory spaces are actually the foundation of democracy. These are the spaces of participation offered by the state and guaranteed by democratic constitutions. For a long time, top-down participation could be equated with formal democratic participation such as elections, referenda or party politics. Today, however, in states like Germany we can observe a new form of top-down political participation, namely government-initiated participation that goes beyond what is legally required and usually makes extensive use of digital media.
Like many other Western states, Germany has to cope with decreasing voter turnout and a lack of trust in political parties. At the same time, according to a recent study from 2012, two-thirds of eligible voters would like to be more involved in political decisions. The case of “Stuttgart 21” served as a late wake-up call for many German municipalities. Plans to construct a new train station in the center of the city of Stuttgart resulted in a petition for a local referendum, which was rejected. Protests against the train station culminated in widespread demonstrations in 2010, forcing construction to be halted. Even though a referendum was finally held in 2011 and a slight majority voted in favor of the train station, the Stuttgart 21 case has since been cited by Chancellor Angela Merkel and others as an example of the negative consequences of taking decisions without consulting with citizens early on. More and more municipalities and federal ministries in Germany have therefore started acknowledging that the conventional democratic model of participation in elections every few years is no longer sufficient. The Federal Ministry of Transport, Building and Urban Development, for example, published a manual for “good participation” in urban development projects….

What’s so great about top-down participation?

Semi-formal top-down participation processes have one major thing in common, regardless of the topic they address: Governmental institutions voluntarily open up a space for dialogue and thereby obligate themselves to take citizens’ concerns and ideas into account.
As a consequence, government-initiated participation offers the potential for institutionalized empowerment beyond elections. It grants the possibility of integrating participation into political and administrative decision-making processes….
Bottom-up participation will surely always be an important mobilizer of democratic change. Nevertheless, the provision of spaces of open participation by governments can aid in the institutionalization of citizens’ involvement in political decision-making. Had Stuttgart offered an open space of participation early in the train station construction process, maybe protests would never have escalated the way they did.
So is top-down participation the next step in the process of democratization? It could be, but only under certain conditions. Most importantly, top-down open participation requires a genuine willingness to abandon the old principle of doing business behind closed doors. This is not an easy undertaking; it requires time and endurance. Serious open participation also requires creating state institutions that ensure the relevance of the results by evaluating them and considering them in political decisions. We have formulated ten conditions that we consider necessary for the genuine institutionalization of open political participation [14]:

  • There needs to be some scope for decision-making. Top-down participation only makes sense when the results of the participation can influence decisions.
  • The government must genuinely aim to integrate the results into decision-making processes.
  • The limits of participation must be communicated clearly. Citizens must be informed if final decision-making power rests with a political body, for example.
  • The subject matter, rules and procedures need to be transparent.
  • Citizens need to be aware that they have the opportunity to participate.
  • Access to participation must be easy, the channels of participation chosen according to the citizens’ media habits. Using the Internet should not be a goal in itself.
  • The participatory space should be “neutral ground”. A moderator can help ensure this.
  • The set-up must be interactive. Providing information is only a prerequisite for participation.
  • Participation must be possible without providing real names or personal data.
  • Citizens must receive continuous feedback regarding how results are handled and the implementation process.”

The Brave New World of Good


Brad Smith: “Welcome to the Brave New World of Good. Once almost the exclusive province of nonprofit organizations and the philanthropic foundations that fund them, today the terrain of good is disputed by social entrepreneurs, social enterprises, impact investors, big business, governments, and geeks. Their tools of choice are markets, open data, innovation, hackathons, and disruption. They cross borders, social classes, and paradigms with the swipe of a touch screen. We seemed poised to unleash a whole new era of social and environmental progress, accompanied by unimagined economic prosperity.
As a brand, good is unassailably brilliant. Who could be against it? It is virtually impossible to write an even mildly skeptical blog post about good without sounding well, bad — or at least a bit old-fashioned. For the record, I firmly believe there is much in the brave new world of good that is helping us find our way out of the tired and often failed models of progress and change on which we have for too long relied. Still, there are assumptions worth questioning and questions worth answering to ensure that the good we seek is the good that can be achieved.

Open Data
Second only to “good” in terms of marketing genius is the concept of “open data.” An offspring of previous movements such as “open source,” “open content,” and “open access,” open data in the Internet age has come to mean data that is machine-readable, free to access, and free to use, re-use, and re-distribute, subject to attribution. Fully open data goes way beyond posting your .pdf document on a Web site (as neatly explained by Tim Berners Lee’s five-star framework).
When it comes to government, there is a rapidly accelerating movement around the world that is furthering transparency by making vast stores of data open. Ditto on the data of international aid funders like the United States Agency for International Development, the World Bank, and the Organisation for Economic Co-operation and Development. The push has now expanded to the tax return data of nonprofits and foundations (IRS Forms 990). Collection of data by government has a business model; it’s called tax dollars. However, open data is not born pure. Cleaning that data, making it searchable, and building and maintaining reliable user interfaces is complex, time-consuming, and often expensive. That requires a consistent stream of income of the kind that can only come from fees, subscriptions, or, increasingly less so, government.
Foundation grants are great for short-term investment, experimentation, or building an app or two, but they are no substitute for a scalable business model. Structured, longitudinal data are vital to social, environmental, and economic progress. In a global economy where government is retreating from the funding of public goods, figuring how to pay for the cost of that data is one of our greatest challenges.”

A Global Online Network Lets Health Professionals Share Expertise


Rebecca Weintraub, Aaron C. Beals, Sophie G. Beauvais, Marie Connelly, Julie Rosenberg Talbot, Aaron VanDerlip, and Keri Wachter in HBR Blog Network : “In response, our team at the Global Health Delivery Project at Harvard launched an online platform to generate and disseminate knowledge in health care delivery. With guidance from Paul English, chief technology officer of Kayak, we borrowed a common tool from business — professional virtual communities (PVCs) — and adapted it to leverage the wisdom of the crowds.  In business, PVCs are used for knowledge management and exchange across multiple organizations, industries, and geographies. In health care, we thought, they could be a rapid, practical means for diverse professionals to share insights and tactics. As GHDonline’s rapid growth and success have demonstrated, they can indeed be a valuable tool for improving the efficiency, quality, and the ultimate value of health care delivery….
Creating a professional virtual network that would be high quality, participatory, and trusted required some trial and error both in terms of the content and technology. What features would make the site inviting, accessible, and useful? How could members establish trust? What would it take to involve professionals from differing time zones in different languages?
The team launched GHDonline in June 2008 with public communities in tuberculosis-infection control, drug-resistant tuberculosis, adherence and retention, and health information technology. Bowing to the reality of the sporadic electricity service and limited internet bandwidth available in many countries, we built a lightweight platform, meaning that the site minimized the use of images and only had features deemed essential….
Even with early successes in terms of membership growth and daily postings to communities, user feedback and analytics directed the team to simplify the user navigation and experience. Longer, more nuanced, in-depth conversations in the communities were turned into “discussion briefs” — two-page, moderator-reviewed summaries of the conversations. The GHDonline team integrated Google Translate to accommodate the growing number of non-native English speakers. New public communities were launched for nursing, surgery, and HIV and malaria treatment and prevention. You can view all of the features of GHDOnline here (PDF).”

Using Big Data to Ask Big Questions


Chase Davis in the SOURCE: “First, let’s dispense with the buzzwords. Big Data isn’t what you think it is: Every federal campaign contribution over the last 30-plus years amounts to several tens of millions of records. That’s not Big. Neither is a dataset of 50 million Medicare records. Or even 260 gigabytes of files related to offshore tax havens—at least not when Google counts its data in exabytes. No, the stuff we analyze in pursuit of journalism and app-building is downright tiny by comparison.
But you know what? That’s ok. Because while super-smart Silicon Valley PhDs are busy helping Facebook crunch through petabytes of user data, they’re also throwing off intellectual exhaust that we can benefit from in the journalism and civic data communities. Most notably: the ability to ask Big Questions.
Most of us who analyze public data for fun and profit are familiar with small questions. They’re focused, incisive, and often have the kind of black-and-white, definitive answers that end up in news stories: How much money did Barack Obama raise in 2012? Is the murder rate in my town going up or down?
Big Questions, on the other hand, are speculative, exploratory, and systemic. As the name implies, they are also answered at scale: Rather than distilling a small slice of a dataset into a concrete answer, Big Questions look at entire datasets and reveal small questions you wouldn’t have thought to ask.
Can we track individual campaign donor behavior over decades, and what does that tell us about their influence in politics? Which neighborhoods in my city are experiencing spikes in crime this week, and are police changing patrols accordingly?
Or, by way of example, how often do interest groups propose cookie-cutter bills in state legislatures?

Looking at Legislation

Even if you don’t follow politics, you probably won’t be shocked to learn that lawmakers don’t always write their own bills. In fact, interest groups sometimes write them word-for-word.
Sometimes those groups even try to push their bills in multiple states. The conservative American Legislative Exchange Council has gotten some press, but liberal groups, social and business interests, and even sororities and fraternities have done it too.
On its face, something about elected officials signing their names to cookie-cutter bills runs head-first against people’s ideal of deliberative Democracy—hence, it tends to make news. Those can be great stories, but they’re often limited in scope to a particular bill, politician, or interest group. They’re based on small questions.
Data science lets us expand our scope. Rather than focusing on one bill, or one interest group, or one state, why not ask: How many model bills were introduced in all 50 states, period, by anyone, during the last legislative session? No matter what they’re about. No matter who introduced them. No matter where they were introduced.
Now that’s a Big Question. And with some basic data science, it’s not particularly hard to answer—at least at a superficial level.

Analyze All the Things!

Just for kicks, I tried building a system to answer this question earlier this year. It was intended as an example, so I tried to choose methods that would make intuitive sense. But it also makes liberal use of techniques applied often to Big Data analysis: k-means clustering, matrices, graphs, and the like.
If you want to follow along, the code is here….
To make exploration a little easier, my code represents similar bills in graph space, shown at the top of this article. Each dot (known as a node) represents a bill. And a line connecting two bills (known as an edge) means they were sufficiently similar, according to my criteria (a cosine similarity of 0.75 or above). Thrown into a visualization software like Gephi, it’s easy to click around the clusters and see what pops out. So what do we find?
There are 375 clusters in total. Because of the limitations of our data, many of them represent vague, subject-specific bills that just happen to have similar titles even though the legislation itself is probably very different (think things like “Budget Bill” and “Campaign Finance Reform”). This is where having full bill text would come handy.
But mixed in with those bills are a handful of interesting nuggets. Several bills that appear to be modeled after legislation by the National Conference of Insurance Legislators appear in multiple states, among them: a bill related to limited lines travel insurance; another related to unclaimed insurance benefits; and one related to certificates of insurance.”

The Shutdown’s Data Blackout


Opinion piece by Katherine G. Abraham and John Haltiwanger in The New York Times: “Today, for the first time since 1996 and only the second time in modern memory, the Bureau of Labor Statistics will not issue its monthly jobs report, as a result of the shutdown of nonessential government services. This raises an important question: Are the B.L.S. report and other economic data that the government provides “nonessential”?

If we’re trying to understand how much damage the shutdown or sequestration cuts are doing to jobs or the fragile economic recovery, they are definitely essential. Without robust economic data from the federal government, we can speculate, but we won’t really know.

In the last two shutdowns, in 1995 and 1996, the Congressional Budget Office estimated the economic damage at around 0.5 percent of the gross domestic product. This time, Moody’s estimates that a three-to-four-week shutdown might subtract 1.4 percent (annualized) from gross domestic product growth this quarter and take $55 billion out of the economy. Democrats tend to play up such projections; Republicans tend to play them down. If the shutdown continues, though, we’ll all be less able to tell what impact it is having, because more reports like the B.L.S. jobs report will be delayed, while others may never be issued.

In fact, sequestration cuts that affected 2013 budgets are already leading federal statistics agencies to defer or discontinue dozens of reports on everything from income to overseas labor costs. The economic data these agencies produce are key to tracking G.D.P., earnings and jobs, and to informing the Federal Reserve, the executive branch and Congress on the state of the economy and the impact of economic policies. The data are also critical for decisions made by state and local policy makers, businesses and households.

The combined budget for all the federal statistics agencies totals less than 0.1 percent of the federal budget. Yet the same across-the-board-cut mentality that led to sequester and shutdown has shortsightedly cut statistics agencies, too, as if there were something “nonessential” about spending money on accurately assessing the economic effects of government actions and inactions. As a result, as we move through the shutdown, the debt-ceiling fight and beyond, reliable, essential data on the impact of policy decisions will be harder to come by.

Unless the sequester cuts are reversed, funding for economic data will shrink further in 2014, on top of a string of lean budget years. More data reports will be eliminated at the B.L.S., the Census Bureau, the Bureau of Economic Analysis and other agencies. Even more insidious damage will come from compromising the methods for producing the reports that still are paid for and from failing to prepare for the future.

To save money, survey sample sizes will be cut, reducing the reliability of national data and undermining local statistics. Fewer resources will be devoted to maintaining the listings used to draw business survey samples, running the risk that surveys based on those listings won’t do as good a job of capturing actual economic conditions. Hiring and training will be curtailed. Over time, the availability and quality of economic indicators will diminish.

That would be especially paradoxical and backward at a time when economic statistics can and should be advancing through technological innovation instead of marched backward by politics. Integrating survey data, administrative data and commercial data collected with scanners and other digital technologies could produce richer, more useful information with less of a burden on businesses and households.

Now more than ever, framing sound economic policy depends on timely and accurate information about the economy. Bad or ill-targeted data can lead to bad or ill-targeted decisions about taxes and spending. The tighter the budget and the more contentious the political debate around it, the more compelling the argument for investing in federal data that accurately show how government policies are affecting the economy, so we can target the most effective cuts or spending or other policies, and make ourselves accountable for their results. That’s why Congress should restore funding to the federal statistical agencies at a level that allows them to carry out their critical work.”

Defining Open Data


Open Knowledge Foundation Blog: “Open data is data that can be freely used, shared and built-on by anyone, anywhere, for any purpose. This is the summary of the full Open Definition which the Open Knowledge Foundation created in 2005 to provide both a succinct explanation and a detailed definition of open data.
As the open data movement grows, and even more governments and organisations sign up to open data, it becomes ever more important that there is a clear and agreed definition for what “open data” means if we are to realise the full benefits of openness, and avoid the risks of creating incompatibility between projects and splintering the community.

Open can apply to information from any source and about any topic. Anyone can release their data under an open licence for free use by and benefit to the public. Although we may think mostly about government and public sector bodies releasing public information such as budgets or maps, or researchers sharing their results data and publications, any organisation can open information (corporations, universities, NGOs, startups, charities, community groups and individuals).

Read more about different kinds of data in our one page introduction to open data
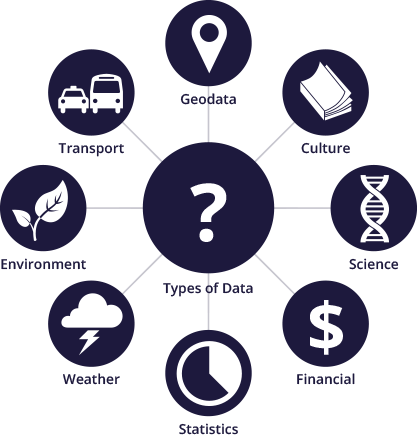
There is open information in transport, science, products, education, sustainability, maps, legislation, libraries, economics, culture, development, business, design, finance …. So the explanation of what open means applies to all of these information sources and types. Open may also apply both to data – big data and small data – or to content, like images, text and music!
So here we set out clearly what open means, and why this agreed definition is vital for us to collaborate, share and scale as open data and open content grow and reach new communities.

What is Open?

The full Open Definition provides a precise definition of what open data is. There are 2 important elements to openness:

  • Legal openness: you must be allowed to get the data legally, to build on it, and to share it. Legal openness is usually provided by applying an appropriate (open) license which allows for free access to and reuse of the data, or by placing data into the public domain.
  • Technical openness: there should be no technical barriers to using that data. For example, providing data as printouts on paper (or as tables in PDF documents) makes the information extremely difficult to work with. So the Open Definition has various requirements for “technical openness,” such as requiring that data be machine readable and available in bulk.”…

New crowdsourcing platform links tech-skilled volunteers with charities


Charity Digital News: “The Atlassian Foundation today previewed its innovative crowdsourcing platform, MakeaDiff.org, which will allow nonprofits to coordinate with technically-skilled volunteers who want to help convert ideas into successful projects…
Once vetted, nonprofits will be able to list their volunteer jobs on the site. Skilled volunteers such as developers, designers, business analysts and project managers will then be able to go online and quickly search the site for opportunities relevant and convenient to them.
Atlassian Foundation manager, Melissa Beaumont Lee, said: “We started hearing from nonprofits that what they valued even more than donations was access to Atlassian’s technology expertise. Similarly, we had lots of employees who were keen to volunteer, but didn’t know how to get involved; coordinating volunteers for all these amazing projects was just not scalable. Thus, MakeaDiff.org was born to benefit both nonprofits and volunteers. We wanted to reduce the friction in coordinating efforts so more time can be spent doing really meaningful work.”
 

Imagining Data Without Division


Thomas Lin in Quanta Magazine: “As science dives into an ocean of data, the demands of large-scale interdisciplinary collaborations are growing increasingly acute…Seven years ago, when David Schimel was asked to design an ambitious data project called the National Ecological Observatory Network, it was little more than a National Science Foundation grant. There was no formal organization, no employees, no detailed science plan. Emboldened by advances in remote sensing, data storage and computing power, NEON sought answers to the biggest question in ecology: How do global climate change, land use and biodiversity influence natural and managed ecosystems and the biosphere as a whole?…
For projects like NEON, interpreting the data is a complicated business. Early on, the team realized that its data, while mid-size compared with the largest physics and biology projects, would be big in complexity. “NEON’s contribution to big data is not in its volume,” said Steve Berukoff, the project’s assistant director for data products. “It’s in the heterogeneity and spatial and temporal distribution of data.”
Unlike the roughly 20 critical measurements in climate science or the vast but relatively structured data in particle physics, NEON will have more than 500 quantities to keep track of, from temperature, soil and water measurements to insect, bird, mammal and microbial samples to remote sensing and aerial imaging. Much of the data is highly unstructured and difficult to parse — for example, taxonomic names and behavioral observations, which are sometimes subject to debate and revision.
And, as daunting as the looming data crush appears from a technical perspective, some of the greatest challenges are wholly nontechnical. Many researchers say the big science projects and analytical tools of the future can succeed only with the right mix of science, statistics, computer science, pure mathematics and deft leadership. In the big data age of distributed computing — in which enormously complex tasks are divided across a network of computers — the question remains: How should distributed science be conducted across a network of researchers?
Part of the adjustment involves embracing “open science” practices, including open-source platforms and data analysis tools, data sharing and open access to scientific publications, said Chris Mattmann, 32, who helped develop a precursor to Hadoop, a popular open-source data analysis framework that is used by tech giants like Yahoo, Amazon and Apple and that NEON is exploring. Without developing shared tools to analyze big, messy data sets, Mattmann said, each new project or lab will squander precious time and resources reinventing the same tools. Likewise, sharing data and published results will obviate redundant research.
To this end, international representatives from the newly formed Research Data Alliance met this month in Washington to map out their plans for a global open data infrastructure.”

User-Generated Content Is Here to Stay


in the Huffington Post: “The way media are transmitted has changed dramatically over the last 10 years. User-generated content (UGC) has completely changed the landscape of social interaction, media outreach, consumer understanding, and everything in between. Today, UGC is media generated by the consumer instead of the traditional journalists and reporters. This is a movement defying and redefining traditional norms at the same time. Current events are largely publicized on Twitter and Facebook by the average person, and not by a photojournalist hired by a news organization. In the past, these large news corporations dominated the headlines — literally — and owned the monopoly on public media. Yet with the advent of smartphones and spread of social media, everything has changed. The entire industry has been replaced; smartphones have supplanted how information is collected, packaged, edited, and conveyed for mass distribution. UGC allows for raw and unfiltered movement of content at lightening speed. With the way that the world works today, it is the most reliable way to get information out. One thing that is for certain is that UGC is here to stay whether we like it or not, and it is driving much more of modern journalistic content than the average person realizes.
Think about recent natural disasters where images are captured by citizen journalists using their iPhones. During Hurricane Sandy, 800,000 photos uploaded onto Instagram with “#Sandy.” Time magazine even hired five iPhoneographers to photograph the wreckage for its Instagram page. During the May 2013 Oklahoma City tornadoes, the first photo released was actually captured by a smartphone. This real-time footage brings environmental chaos to your doorstep in a chillingly personal way, especially considering the photographer of the first tornado photos ultimately died because of the tornado. UGC has been monumental for criminal investigations and man-made catastrophes. Most notably, the Boston Marathon bombing was covered by UGC in the most unforgettable way. Dozens of images poured in identifying possible Boston bombers, to both the detriment and benefit of public officials and investigators. Though these images inflicted considerable damage to innocent bystanders sporting suspicious backpacks, ultimately it was also smartphone images that highlighted the presence of the Tsarnaev brothers. This phenomenon isn’t limited to America. Would the so-called Arab Spring have happened without social media and UGC? Syrians, Egyptians, and citizens from numerous nations facing protests can easily publicize controversial images and statements to be shared worldwide….
This trend is not temporary but will only expand. The first iPhone launched in 2007, and the world has never been the same. New smartphones are released each month with better cameras and faster processors than computers had even just a few years ago….”