The Surprising History of the Infographic


Clive Thompson at the Smithsonian magazine: “As the 2016 election approaches, we’re hearing a lot about “red states” and “blue states.” That idiom has become so ingrained that we’ve almost forgotten where it originally came from: a data visualization.

In the 2000 presidential election, the race between Al Gore and George W. Bush was so razor close that broadcasters pored over electoral college maps—which they typically colored red and blue. What’s more, they talked about those shadings. NBC’s Tim Russert wondered aloud how George Bush would “get those remaining 61 electoral red states, if you will,” and that language became lodged in the popular imagination. America became divided into two colors—data spun into pure metaphor. Now Americans even talk routinely about “purple” states, a mental visualization of political information.

We live in an age of data visualization. Go to any news website and you’ll see graphics charting support for the presidential candidates; open your iPhone and the Health app will generate personalized graphs showing how active you’ve been this week, month or year. Sites publish charts showing how the climate is changing, how schools are segregating, how much housework mothers do versus fathers. And newspapers are increasingly finding that readers love “dataviz”: In 2013, the New York Times’ most-read story for the entire year was a visualization of regional accents across the United States. It makes sense. We live in an age of Big Data. If we’re going to understand our complex world, one powerful way is to graph it.

But this isn’t the first time we’ve discovered the pleasures of making information into pictures. Over a hundred years ago, scientists and thinkers found themselves drowning in their own flood of data—and to help understand it, they invented the very idea of infographics.

**********

The idea of visualizing data is old: After all, that’s what a map is—a representation of geographic information—and we’ve had maps for about 8,000 years. But it was rare to graph anything other than geography. Only a few examples exist: Around the 11th century, a now-anonymous scribe created a chart of how the planets moved through the sky. By the 18th century, scientists were warming to the idea of arranging knowledge visually. The British polymath Joseph Priestley produced a “Chart of Biography,” plotting the lives of about 2,000 historical figures on a timeline. A picture, he argued, conveyed the information “with more exactness, and in much less time, than it [would take] by reading.”

Still, data visualization was rare because data was rare. That began to change rapidly in the early 19th century, because countries began to collect—and publish—reams of information about their weather, economic activity and population. “For the first time, you could deal with important social issues with hard facts, if you could find a way to analyze it,” says Michael Friendly, a professor of psychology at York University who studies the history of data visualization. “The age of data really began.”

An early innovator was the Scottish inventor and economist William Playfair. As a teenager he apprenticed to James Watt, the Scottish inventor who perfected the steam engine. Playfair was tasked with drawing up patents, which required him to develop excellent drafting and picture-drawing skills. After he left Watt’s lab, Playfair became interested in economics and convinced that he could use his facility for illustration to make data come alive.

“An average political economist would have certainly been able to produce a table for publication, but not necessarily a graph,” notes Ian Spence, a psychologist at the University of Toronto who’s writing a biography of Playfair. Playfair, who understood both data and art, was perfectly positioned to create this new discipline.

In one famous chart, he plotted the price of wheat in the United Kingdom against the cost of labor. People often complained about the high cost of wheat and thought wages were driving the price up. Playfair’s chart showed this wasn’t true: Wages were rising much more slowly than the cost of the product.

JULAUG2016_H04_COL_Clive.jpg
Playfair’s trade-balance time-series chart, published in his Commercial and Political Atlas, 1786 (Wikipedia)

“He wanted to discover,” Spence notes. “He wanted to find regularities or points of change.” Playfair’s illustrations often look amazingly modern: In one, he drew pie charts—his invention, too—and lines that compared the size of various country’s populations against their tax revenues. Once again, the chart produced a new, crisp analysis: The British paid far higher taxes than citizens of other nations.

Neurology was not yet a robust science, but Playfair seemed to intuit some of its principles. He suspected the brain processed images more readily than words: A picture really was worth a thousand words. “He said things that sound almost like a 20th-century vision researcher,” Spence adds. Data, Playfair wrote, should “speak to the eyes”—because they were “the best judge of proportion, being able to estimate it with more quickness and accuracy than any other of our organs.” A really good data visualization, he argued, “produces form and shape to a number of separate ideas, which are otherwise abstract and unconnected.”

Soon, intellectuals across Europe were using data visualization to grapple with the travails of urbanization, such as crime and disease….(More)”

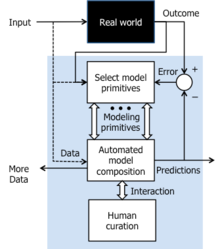
DARPA wants to design an army of ultimate automated data scientists


Michael Cooney in NetworkWorld: “Because of a plethora of data from sensor networks, Internet of Things devices and big data resources combined with a dearth of data scientists to effectively mold that data, we are leaving many important applications – from intelligence to science and workforce management – on the table.

It is a situation the researchers at DARPA want to remedy with a new program called Data-Driven Discovery of Models (D3M). The goal of D3M is to develop algorithms and software to help overcome the data-science expertise gap by facilitating non-experts to construct complex empirical models through automation of large parts of the model-creation process. If successful, researchers using D3M tools will effectively have access to an army of “virtual data scientists,” DARPA stated.

d3mfigureDARPA

This army of virtual data scientists is needed because some experts project deficits of 140,000 to 190,000 data scientists worldwide in 2016 alone, and increasing shortfalls in coming years. Also, because the process to build empirical models is so manual, their relative sophistication and value is often limited, DARPA stated.

“We have an urgent need to develop machine-based modeling for users with no data-science background. We believe it’s possible to automate certain aspects of data science, and specifically to have machines learn from prior example how to construct new models,” said Wade Shen, program manager in DARPA’s Information Innovation Office in a statement….(More)”

Big Data Challenges: Society, Security, Innovation and Ethics


Book edited by Bunnik, A., Cawley, A., Mulqueen, M., Zwitter, A: “This book brings together an impressive range of academic and intelligence professional perspectives to interrogate the social, ethical and security upheavals in a world increasingly driven by data. Written in a clear and accessible style, it offers fresh insights to the deep reaching implications of Big Data for communication, privacy and organisational decision-making. It seeks to demystify developments around Big Data before evaluating their current and likely future implications for areas as diverse as corporate innovation, law enforcement, data science, journalism, and food security. The contributors call for a rethinking of the legal, ethical and philosophical frameworks that inform the responsibilities and behaviours of state, corporate, institutional and individual actors in a more networked, data-centric society. In doing so, the book addresses the real world risks, opportunities and potentialities of Big Data….(More)”

The Perils of Using Technology to Solve Other People’s Problems


Ethan Zuckerman in The Atlantic: “I found Shane Snow’s essay on prison reform — “How Soylent and Oculus Could Fix the Prison System” — through hate-linking….

Some of my hate-linking friends began their eye-rolling about Snow’s article with the title, which references two of Silicon Valley’s most hyped technologies. With the current focus on the U.S. as an “innovation economy,” it’s common to read essays predicting the end of a major social problem due to a technical innovation.Bitcoin will end poverty in the developing world by enabling inexpensive money transfers. Wikipedia and One Laptop Per Child will educate the world’s poor without need for teachers or schools. Self driving cars will obviate public transport and reshape American cities.

The writer Evgeny Morozov has offered a sharp and helpful critique to this mode of thinking, which he calls “solutionism.” Solutionism demands that we focus on problems that have “nice and clean technological solution at our disposal.” In his book, To Save Everything, Click Here, Morozov savages ideas like Snow’s, regardless of whether they are meant as thought experiments or serious policy proposals. (Indeed, one worry I have in writing this essay is taking Snow’s ideas too seriously, as Morozov does with many of the ideas he lambastes in his book.)

The problem with the solutionist critique, though, is that it tends to remove technological innovation from the problem-solver’s toolkit. In fact, technological development is often a key component in solving complex social and political problems, and new technologies can sometimes open a previously intractable problem. The rise of inexpensive solar panels may be an opportunity to move nations away from a dependency on fossil fuels and begin lowering atmospheric levels of carbon dioxide, much as developments in natural gas extraction and transport technologies have lessened the use of dirtier fuels like coal.

But it’s rare that technology provides a robust solution to a social problem by itself. Successful technological approaches to solving social problems usually require changes in laws and norms, as well as market incentives to make change at scale….

Design philosophies like participatory design and codesign bring this concept to the world of technology, demanding that technologies designed for a group of people be designed and built, in part, by those people. Codesign challenges many of the assumptions of engineering, requiring people who are used to working in isolation to build broad teams and to understand that those most qualified to offer a technical solution may be least qualified to identify a need or articulate a design problem. This method is hard and frustrating, but it’s also one of the best ways to ensure that you’re solving the right problem, rather than imposing your preferred solution on a situation…(More)”

This text-message hotline can predict your risk of depression or stress


Clinton Nguyen for TechInsider: “When counselors are helping someone in the midst of an emotional crisis, they must not only know how to talk – they also must be willing to text.

Crisis Text Line, a non-profit text-message-based counseling service, operates a hotline for people who find it safer or easier to text about their problems than make a phone call or send an instant message. Over 1,500 volunteers are on hand 24/7 to lend support about problems including bullying, isolation, suicidal thoughts, bereavement, self-harm, or even just stress.

But in addition to providing a new outlet for those who prefer to communicate by text, the service is gathering a wellspring of anonymized data.

“We look for patterns in historical conversations that end up being higher risk for self harm and suicide attempts,” Liz Eddy, a Crisis Text Line spokesperson, tells Tech Insider. “By grounding in historical data, we can predict the risk of new texters coming in.crisis-text-line-sms

According to Fortune, the organization is using machine learning to prioritize higher-risk individuals for quicker and more effective responses. But Crisis Text Line is also wielding the data it gathers in other ways – the company has published a page of trends that tells the public which hours or days people are more likely to be affected by certain issues, as well as which US states are most affected by specific crises or psychological states.

According to the data, residents of Alaska reach out to the Text Line for LGBTQ issues more than those in other states, and Maine is one of the most stressed out states. Physical abuse is most commonly reported in North Dakota and Wyoming, while depression is more prevalent in texters from Kentucky and West Virginia.

The research comes at an especially critical time. According to studies from the National Center for Health Statistics, US suicide rates have surged to a 30-year high. The study noted a rise in suicide rates for all demographics except black men over the age of 75. Alarmingly, the suicide rate among 10- to 14-year-old girls has tripled since 1999….(More)”

The Billions We’re Wasting in Our Jails


Stephen Goldsmith  and Jane Wiseman in Governing: “By using data analytics to make decisions about pretrial detention, local governments could find substantial savings while making their communities safer….

Few areas of local government spending present better opportunities for dramatic savings than those that surround pretrial detention. Cities and counties are wasting more than $3 billion a year, and often inducing crime and job loss, by holding the wrong people while they await trial. The problem: Only 10 percent of jurisdictions use risk data analytics when deciding which defendants should be detained.

As a result, dangerous people are out in our communities, while many who could be safely in the community are behind bars. Vast numbers of people accused of petty offenses spend their pretrial detention time jailed alongside hardened convicts, learning from them how to be better criminals….

In this era of big data, analytics not only can predict and prevent crime but also can discern who should be diverted from jail to treatment for underlying mental health or substance abuse issues. Avoided costs aggregating in the billions could be better spent on detaining high-risk individuals, more mental health and substance abuse treatment, more police officers and other public safety services.

Jurisdictions that do use data to make pretrial decisions have achieved not only lower costs but also greater fairness and lower crime rates. Washington, D.C., releases 85 percent of defendants awaiting trial. Compared to the national average, those released in D.C. are two and a half times more likely to remain arrest-free and one and a half times as likely to show up for court.

Louisville, Ky., implemented risk-based decision-making using a tool developed by the Laura and John Arnold Foundation and now releases 70 percent of defendants before trial. Those released have turned out to be twice as likely to return to court and to stay arrest-free as those in other jurisdictions. Mesa County, Colo., and Allegheny County, Pa., both have achieved significant savings from reduced jail populations due to data-driven release of low-risk defendants.

Data-driven approaches are beginning to produce benefits not only in the area of pretrial detention but throughout the criminal justice process. Dashboards now in use in a handful of jurisdictions allow not only administrators but also the public to see court waiting times by offender type and to identify and address processing bottlenecks….(More)”

Post, Mine, Repeat: Social Media Data Mining Becomes Ordinary


Book by Helen Kennedy that “…argues that as social media data mining becomes more and more ordinary, as we post, mine and repeat, new data relations emerge. These new data relations are characterised by a widespread desire for numbers and the troubling consequences of this desire, and also by the possibility of doing good with data and resisting data power, by new and old concerns, and by instability and contradiction. Drawing on action research with public sector organisations, interviews with commercial social insights companies and their clients, focus groups with social media users and other research, Kennedy provides a fascinating and detailed account of living with social media data mining inside the organisations that make up the fabric of everyday life….(More)”

The Ideal Digital City


Digital Communities Special Report: “With urban areas continuing to grow at a substantial rate — from 30 percent of the world’s population in 1930 to a projected 66 percent by 2050, according to the United Nations — getting the urban experience right has become paramount. To help understand the building blocks to a successful digital city, The Digital Communities Special Report looks at five key technologies — broadband, open data, GIS, CRM and analytics — and provides a window into how they are helping city governments cope with economic, educational and societal demands.

The good news is that these essential technologies are getting cheaper, faster and better all the time. But technologies like these still cost money, need talent to run them and are dependent on the right policies if they are going to succeed. In other words, digital cities need smart thinking in order to work. Part one of this series examines the importance of broadband as a critical infrastructure and the challenges cities face in reaching universal adoption.

Part 1 | Broadband: 21st Century Infrastructure

Part 2 | Open Data & APIs: Collecting and Consuming What Cities Produce

Part 3 | GIS: An Established Technology Finds New Purpose

Part 4 | Customer Relationship Management: Diversity in Service

Part 5 | Analytics: Making Sense of City Data…(More)”

Civic Data Initiatives


Burak Arikan at Medium: “Big data is the term used to define the perpetual and massive data gathered by corporations and governments on consumers and citizens. When the subject of data is not necessarily individuals but governments and companies themselves, we can call it civic data, and when systematically generated in large amounts, civic big data. Increasingly, a new generation of initiatives are generating and organizing structured data on particular societal issues from human rights violations, to auditing government budgets, from labor crimes to climate justice.

These civic data initiatives diverge from the traditional civil society organizations in their outcomes,that they don’t just publish their research as reports, but also open it to the public as a database.Civic data initiatives are quite different in their data work than international non-governmental organizations such as UN, OECD, World Bank and other similar bodies. Such organizations track social, economical, political conditions of countries and concentrate upon producing general statistical data, whereas civic data initiatives aim to produce actionable data on issues that impact individuals directly. The change in the GDP value of a country is useless for people struggling for free transportation in their city. Incarceration rate of a country does not help the struggle of the imprisoned journalists. Corruption indicators may serve as a parameter in a country’s credit score, but does not help to resolve monopolization created with public procurement. Carbon emission statistics do not prevent the energy deals between corrupt governments that destroy the nature in their region.

Needless to say, civic data initiatives also differ from governmental institutions, which are reluctant to share any more that they are legally obligated to. Many governments in the world simply dump scanned hardcopies of documents on official websites instead of releasing machine-readable data, which prevents systematic auditing of government activities.Civic data initiatives, on the other hand, make it a priority to structure and release their data in formats that are both accessible and queryable.

Civic data initiatives also deviate from general purpose information commons such as Wikipedia. Because they consistently engage with problems, closely watch a particular societal issue, make frequent updates,even record from the field to generate and organize highly granular data about the matter….

Several civic data initiatives generate data on variety of issues at different geographies, scopes, and scales. The non-exhaustive list below have information on founders, data sources, and financial support. It is sorted according to each initiative’s founding year. Please send your suggestions to contact at graphcommons.com. See more detailed information and updates on the spreadsheet of civic data initiatives.

Open Secrets tracks data about the money flow in the US government, so it becomes more accessible for journalists, researchers, and advocates.Founded as a non-profit in 1983 by Center for Responsive Politics, gets support from variety of institutions.

PolitiFact is a fact-checking website that rates the accuracy of claims by elected officials and others who speak up in American politics. Uses on-the-record interviews as its data source. Founded in 2007 as a non-profit organization by Tampa Bay Times. Supported by Democracy Fund, Bill &Melinda Gates Foundation, John S. and James L. Knight Foundation, FordFoundation, Knight Foundation, Craigslist Charitable Fund, and the CollinsCenter for Public Policy…..

La Fabrique de La loi (The Law Factory) maps issues of local-regional socio-economic development, public investments, and ecology in France.Started in 2014, the project builds a database by tracking bills from government sources, provides a search engine as well as an API. The partners of the project are CEE Sciences Po, médialab Sciences Po, RegardsCitoyens, and Density Design.

Mapping Media Freedom identifies threats, violations and limitations faced by members of the press throughout European Union member states,candidates for entry and neighbouring countries. Initiated by Index onCensorship and European Commission in 2004, the project…(More)”

Social Networks and Protest Participation: Evidence from 93 Million Twitter Users


Paper by Jennifer Larson et al for Political Networks Workshops & Conference 2016: “Pinning down the role of social ties in the decision to protest has been notoriously elusive, largely due to data limitations. The era of social media and its global use by protesters offers an unprecedented opportunity to observe real-time social ties and online behavior, though often without an attendant measure of real-world behavior. We collect data on Twitter activity during the 2015 Charlie Hebdo protests in Paris which, unusually, record both real-world protest attendance and high-resolution network structure. We specify a theory of participation in which an individual’s decision depends on her exposure to others’ intentions, and network position determines exposure. Our findings are strong and consistent with this theory, showing that, relative to comparable Twitter users, protesters are significantly more connected to one another via direct, indirect, triadic, and reciprocated ties. These results offer the first large-scale empirical support for the claim that social network structure influences protest participation….(More)’