Stefaan Verhulst
The McKinsey Center for Government: “Governments face a pressing question: How to do more with less? Raising productivity could save $3.5 trillion a year—or boost outcomes at no extra cost.
Higher costs and rising demand have driven rapid increases in spending on core public services such as education, healthcare, and transport—while countries must grapple with complex challenges such as population aging, economic inequality, and protracted security concerns. Government expenditure amounts to more than a third of global GDP, budgets are strained, and the world public-sector deficit is close to $4 trillion a year.
At the same time, governments are struggling to meet citizens’ rising expectations. Satisfaction with key state services, such as public transportation, schools, and healthcare facilities, is less than half that of nonstate providers, such as banks or utilities.
Governments need a way to deliver better outcomes—and a better experience for citizens—at a sustainable cost. A new paper by the McKinsey Center for Government (MCG), Government productivity: Unlocking the $3.5 trillion opportunity, suggests that goal is within reach. It shows that several countries have achieved dramatic productivity improvements in recent years—for example, by improving health, public safety, and education outcomes while maintaining or even reducing spending per capita or per student in those sectors.
If other countries were to match the improvements already demonstrated in these pockets of excellence, the world’s governments could potentially save as much as $3.5 trillion a year by 2021—equivalent to the entire global fiscal gap. Alternatively, countries could choose to keep spending constant while boosting the quality of key services. For example, if all the countries studied had improved the productivity of their healthcare systems at the rate of comparable best performers over the past 5 years, they would have added 1.4 years to the healthy life expectancy of their combined populations. That translates into 12 billion healthy life years gained, without additional per capita spending…(More)”
The opportunity in government productivity
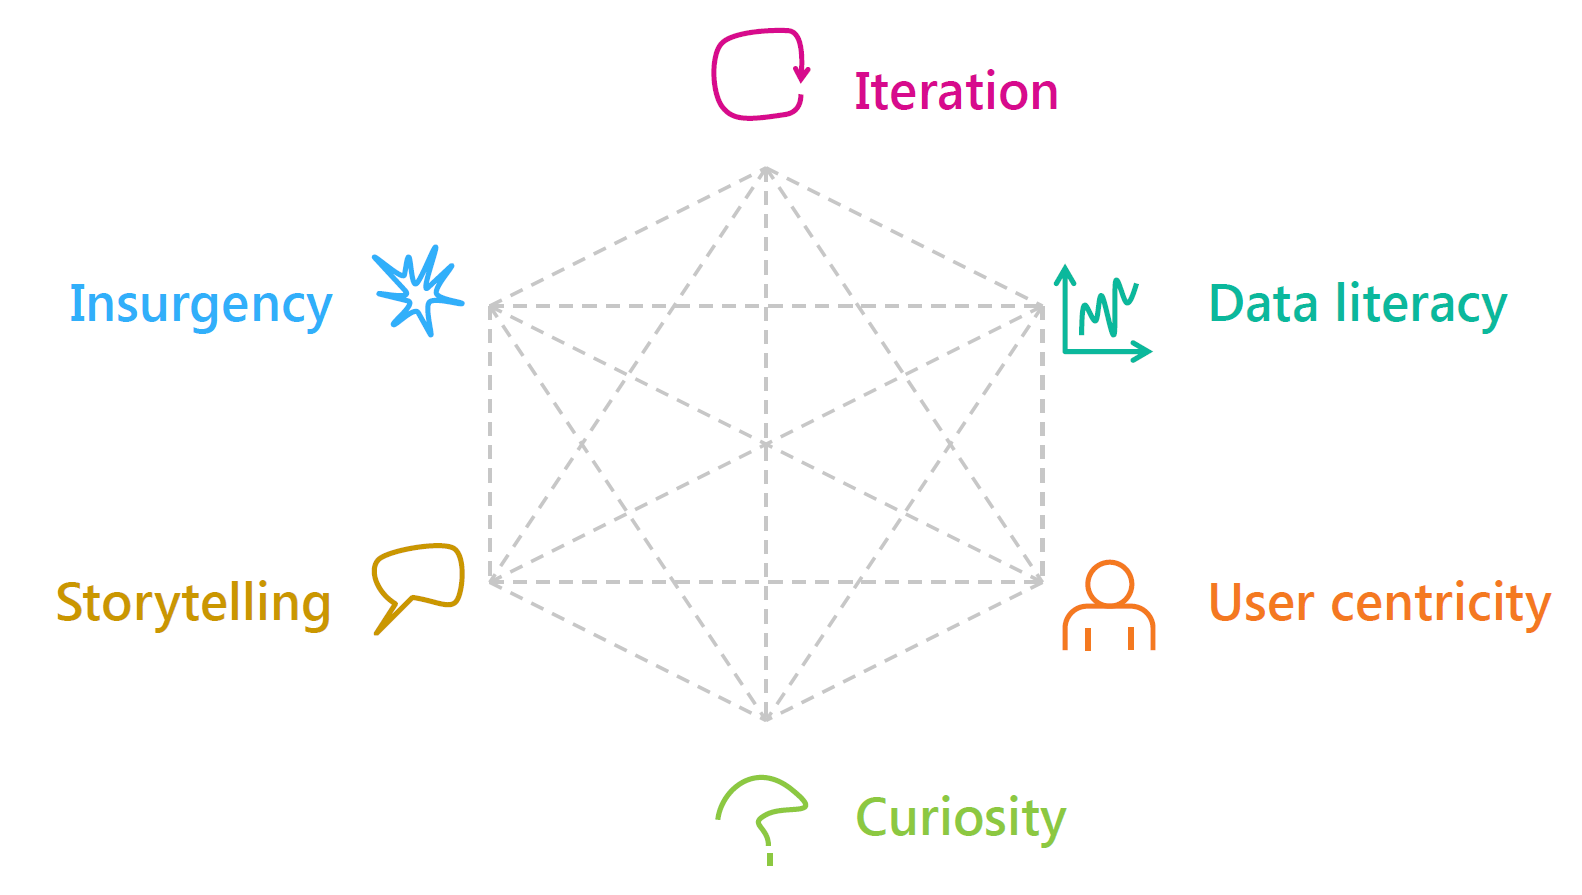
Matt Kerlogue at the OECD: “… has been investigating the topic of skills for public sector innovation. The result of our work has been to produce a beta model of “core skills” for public sector innovation which we are sharing for comment. Our work on innovation skills also sits within the framework of the OECD’s skills for a 21st century Civil Service, and the beta model of core skills for public sector innovation will ultimately form an annex to this work programme’s final report.
Our skills model is designed around six areas of “core skills”: iteration, data literacy, user centricity, curiosity, storytelling, and insurgency. These six skills areas are not the only skills for public sector innovation, each innovation project and challenge will have its own particular needs. Nor will all public servants need to make use of or apply these skills in every aspect of their day-to-day job. Rather, these are six skills areas that with proper promotion/advocacy and development we believe can enable a wider adoption of innovation practices and thus an increased level of innovation. In fact, there are a number of other skills that are already covered in existing public sector competency frameworks that are relevant for innovation, such as collaboration, strategic thinking, political awareness, coaching.
…(More)”
How can government officials become innovators?
Duncan Green at LSE Impact Blog: “The case for partnership between international non-governmental organisations (INGOs) and academia to advance development knowledge is strong. INGOs bring presence on the ground – through their own operations or long-term local partnerships – and communication and advocacy skills (not always academics’ strong point). Academia contributes research skills and credibility, and a long-term reflective perspective that the more frenetic forms of operational work and activism often lack.
In practice, however, such partnerships have proven remarkably difficult, partly because INGOs and academia are too complementary – there is so little overlap between their respective worlds that it is often difficult to find ways to work together.
Obstacles to collaboration
- Impact vs publication:…
- Urgency vs “wait and see”: …
- Status quo vs originality: …
- Thinking vs talking: ….
Systems thinking approaches
Some of the problems that arise in the academic–INGO interface stem from overly linear approaches to what is, in effect, an ideas and knowledge ecosystem. In such contexts, systems thinking can help identify bottlenecks and suggest possible ways forward.
Getting beyond supply and demand to convening and brokering
Supply-driven is the norm in development research – “experts” churning out policy papers, briefings, books, blogs, etc. Being truly demand-driven is hard even to imagine – an NGO or university department submitting themselves to a public poll on what should be researched? But increasingly in areas such as governance or value chains, we try and move beyond both supply and demand to a convening/brokering role, bringing together different “unusual suspects”. What would that look like in research? Action research, with an agenda that emerges from an interaction between communities and researchers? Natural science seems further ahead on this point: when the Dutch National Research Agenda ran a nationwide citizen survey of research questions they wanted science to look at, 12,000 questions were submitted and clustered into 140 questions, under seven or eight themes. To the organisers’ surprise, many citizens asked quite deep questions.
Most studies identify a need for “knowledge brokers” not only to bridge the gap between the realms of science and policy, but also to synthesise and transform evidence into an effective and usable form for policy and practice. An essential feature of knowledge brokers is that they understand the cultures of both worlds. Often, this role is performed by third-sector organisations of various types (from lobbyists to thinktanks to respected research funders). Some academics can transcend this divide. A few universities employ specialist knowledge brokers but their long-term effectiveness is often constrained by low status, insecure contracts and lack of career pathways. Whoever plays this crucial intermediary role, it appears that it is currently under-resourced within and beyond the university system. In the development sector, the nearest thing to an embedded gateway is the Governance and Social Development Resource Centre (GSDRC), run by Birmingham University and the IDS and largely funded by the Department for International Development. It conducts literature and evidence reviews on a range of topics, drawing evidence from both academic literature and non-academic institutions….
Ways forward
Based on all of the above, a number of ideas emerge for consideration by academics, INGOs and funders of research.
Suggestions for academics
Comments on previous blog posts provided a wealth of practical advice to academics on how to work more productively with INGOs. These include the following:
- Create research ideas and proposals collaboratively. This means talking to each other early on, rather than academics looking for NGOs to help their dissemination, or NGOs commissioning academics to undertake policy-based evidence making.
- Don’t just criticise and point to gaps – understand the reasons for them (gaps in both NGO programmes and their research capacity) and propose solutions. Work to recognise practitioners’ strengths and knowledge.
- Make research relevant to real people in communities. This means proper discussions and dialogue at design, research and analysis stages, disseminated drafts and discussing findings locally on publication.
- Set up reflection spaces in universities where NGO practitioners can go to take time out and be supported to reflect on and write up their experiences, network with others, and gain new insights on their work.
- Catalyse more exchange of personnel in both directions. Universities could replicate my own Professor in Practice position at the London School of Economics and Political Science, while INGOs could appoint honorary fellows, who could help guide their thinking in return for access to their work….(More)”.
The NGO-Academia interface: obstacles to collaboration, lessons from systems thinking and suggested ways forward
Anne Glusker at Smithsonian: “…Grimsson’s group felt that due to changes in information technology and social transformations, the large organizations and structures that used to be necessary to effect change were now not needed. And thus was born Roadmap, a new crowdsourcing tool for anyone and everyone interested in climate action. Still in its very early stages, Roadmap’s founders envision it as a platform for those working on climate issues—from scientist and policymaker to farmer and fisherman—to facilitate the sharing of knowledge and ideas, methods and techniques.
“A new political model is possible—where everyone can be a doer, where you no longer need big government or big enterprises to bring about success,” Grimsson says.
This new model for social change that skips the usual cumbersome channels and processes has been seen everywhere from public health, where the Bill & Melinda Gates Foundation has redefined the sector, to the hospitality industry, which is working to combat the human trafficking that plagues its businesses, to perhaps most famously the Arab Spring, where the role of social media in bringing about political change is still being debated today.
And this new model is complemented by technological changes. “The innovation in energy technology is such that we no longer have to wait for the big energy breakthrough,” Grimsson says. “We already have the available technologies. Every individual, home, village, community, town and region can execute change. The good news from the climate point of view is that, in addition to the information technology revolution, there has now also taken place an energy revolution. A house can be a power station: If the people who live in that house have extra energy, they can sell their energy through the smart grid. The notion that every house can be a power station is as revolutionary as saying that every mobile phone can be a media company.”
Grimsson admits that it may seem odd for someone in his position to be advocating that ordinary citizens take action apart from the conventional corridors of governmental power.
“For me to say that these traditional political organizations and positions are somewhat outdated is perhaps a strange statement: I was a professor of political science, I’ve been a member of parliament, I’ve been a minister of finance, I was president for 20 years,” he says.
It was during Iceland’s financial meltdown that he first experienced this new kind of social change: “I saw this very strongly through the financial crisis in my own country, which led to a big social economic uprising. All those activities were engineered by unknown people, people who were not part of a big organization, who used Facebook and the information media to bring thousands of people together in one day.”
Right now, Roadmap consists of a website and a lofty manifesto that speaks of raising the value of “moral currency” and creating a “best practices warehouse.” Visitors to the site can fill out a form if they want to become part of its community of “doers.” The practical part of the manifesto speaks of identifying the best methodologies and models; implementing a “real-time system of measurement” and a way to “gauge and understand what is working, what is not, and exactly what is being achieved.” As the platform develops, it will be interesting to see exactly what form these gauges, measurement systems, and warehouses take….(More)”.
Using a New Roadmap to Democratize Climate Change
Book edited by Alois A. Paulin, Leonidas G. Anthopoulos and Christopher Reddick: “… examines the role of bureaucracy in modern technologically advanced societies, the traditional models of governance, and the potential of information technology to fundamentally change and improve governance. In the area of public-domain governance, information and communication technologies (ICTs) have empowered public agencies to improve their activities and to strengthen the efficiency of their operations. Technology has enabled optimized transfer of knowledge and information between government agencies, more efficient supervision and control of relationships with citizens, and higher efficiency in law enforcement through better access to information. Throughout the last decades, technology has been used to strengthen the role of state bureaucracies and the relationship between the civil service and the citizens. We have witnessed the transformative powers of ICTs in private-sector enterprises in well-structured technological landscapes, which has produced new ecosystems comprised of software developers, providers, and consumers who provide and consume new products and services in ecosystems that are based on clear technological standards and shared modular generic artefacts, which allow for distributed peer production. ICTs will shape cultural and civic discourse and create products, services and tools, relying on the open toolsets, technologies and exchange of knowledge between peers. This book will be of particular interest to government CIOs, IT/IS managers, researchers, students, and practitioners in technical sciences, public administration, business management, public policy and IS management….(More)”.
Beyond Bureaucracy: Towards Sustainable Governance Informatisation
Barbara Fister at Inside HigherEd: “Of all of our cultural institutions, the public library is remarkable. There are few tax-supported services that are used by people of all ages, classes, races, and religions. I can’t think of any public institutions (except perhaps parks) that are as well-loved and widely used as libraries. Nobody has suggested that tax dollars be used for vouchers to support the development of private libraries or that we shouldn’t trust those “government” libraries. Even though the recession following the 2008 crash has led to reduced staff and hours in American libraries, threats of closure are generally met with vigorous community resistance. Visits and check-outs are up significantly over the past ten years, though it has decreased a bit in recent years. Reduced funding seems to be a factor, though the high point was 2009; library use parallels unemployment figures – low unemployment often means fewer people use public libraries. A for-profit company that claims to run libraries more cheaply than local governments currently has contracts to manage only sixteen of over 9,000 public library systems in the U.S. Few public institutions have been so impervious to privatization.
I find it intriguing that the American public library grew out of an era that has many similarities to this one – the last quarter of the 19th century, when large corporations owned by the super-rich had gained the power to shape society and fundamentally change the lives of ordinary people. It was also a time of new communication technologies, novel industrial processes, and data-driven management methods that treated workers as interchangeable cogs in a Tayloristic, efficient machine. Stuff got cheaper and more abundant, but wages fell and employment was precarious, with mass layoffs common. The financial sector was behaving badly, too, leading to cyclical panics and depressions. The gap between rich and poor grew, with unprecedented levels of wealth concentrated among a tiny percentage of the population. It all sounds strangely familiar.
The changes weren’t all economic. A wave of immigration, largely from southern and eastern Europe and from the Far East before the Chinese Exclusion Act of 1882, changed national demographics. Teddy Roosevelt warned of “race suicide,” urging white protestant women to reproduce at the same rate as other groups to make America Anglo-Saxon again. The hard-won rights of emancipated African Americans were systematically rolled back through voter suppression, widespread acts of terror, and the enactment of Jim Crow laws. Indigenous people faced broken treaties, seized land, military suppression, and forced assimilation.
How interesting that it was during this turbulent time of change when the grand idea of the American public library – a publicly-supported cultural institution that would be open to all members of the community for their enjoyment and education – emerged….(More)”.
How Libraries Became Public
Datakind: “Tens of thousands of people are killed or injured in traffic collisions each year. To improve road safety and combat life-threatening crashes, over 25 U.S. cities have adopted Vision Zero, an initiative born in Sweden in the 1990’s that aims to reduce traffic-related deaths and serious injuries to zero. Vision Zero is built upon the belief that crashes are predictable and preventable, though determining what kind of engineering, enforcement and educational interventions are effective can be difficult and costly for cities with limited resources.
To help the cities answer these questions, DataKind launched its first ever Labs project, led by DataKind data scientists Erin Akred, Michael Dowd, Jackie Weiser and Sina Kashuk. A DataDive was held in Seattle to help support the project. Dozens of volunteers participated in the event and helped fuel the work that was achieved, including volunteers from Microsoft and the University of Washington’s E-Science Institute, as well as many other Seattle data scientists.
The DataKind team also worked closely with local city officials and transportation experts to gain valuable insight and feedback on the project, and access a wide variety of datasets, such as information on past crashes, roadway attributes (e.g. lanes, traffic signals, and sidewalks), land use, demographic data, commuting patterns, parking violations, and existing safety intervention placements.
The cities provided information about their priority issues, expertise on their local environments, access to their data, and feedback on the models and analytic insights. Microsoft enabled the overall collaboration by providing resources, including expertise in support of the collaborative model, technical approaches, and project goals.
Below are detailed descriptions of the specific local traffic safety questions each city asked, the data science approach and outputs the DataKind team developed, and the outcomes and impacts these analyses are providing each city….(More)”
Creating Safer Streets Through Data Science
Allie Lieber at The Keyword: “Today is World Malaria Day, a moment dedicated to raising awareness and improving access to tools to prevent malaria. The World Health Organization says nearly half of the world’s population is at risk for malaria, and estimates that in 2015 there were 212 million malaria cases resulting in 429,000 deaths. In places with high transmission rates, children under five account for 70 percent of malaria deaths.
DiSARM (Disease Surveillance and Risk Monitoring), a project led by the Malaria Elimination Initiative and supported by the Bill and Melinda Gates Foundationand Clinton Health Access Initiative, is fighting the spread of malaria by mapping the places where malaria could occur. With the help of Google Earth Engine, DiSARM creates high resolution “risk maps” that help malaria control programs identify the areas where they should direct resources for prevention and treatment.
We sat down with Hugh Sturrock, who leads the DiSARM project and is an Assistant Professor of Epidemiology and Biostatistics in the University of California, San Francisco’s Global Health Group, to learn more about DiSARM’s fight against malaria, and how Google fits in….
How does DiSARM use Google Earth Engine to help fight malaria?
If we map where malaria is most likely to occur, we can target those areas for action. Every time someone is diagnosed with malaria in Swaziland and Zimbabwe, a team goes to the village where the infection occurred and collects a GPS point with the precise infection location. Just looking at these points won’t allow you to accurately determine the risk of malaria, though. You also need satellite imagery of conditions like rainfall, temperature, slope and elevation, which affect mosquito breeding and parasite development.
To determine the risk of malaria, DiSARM combines the precise location of the malaria infection, with satellite data of conditions like rainfall, temperature, vegetation, elevation, which affect mosquito breeding. DiSARM’s mobile app can be used by the malaria programs and field teams to target interventions.
Google Earth Engine collects and organizes the public satellite imagery data we need. In the past we had to obtain those images from a range of sources: NASA, USGS and different universities around the world. But with Google Earth Engine, it’s all in one place and can be processed using Google computers. We combine satellite imagery data from Google Earth Engine with the locations of malaria cases collected by a country’s national malaria control program, and create models that let us generate maps identifying areas at greatest risk.
The DiSARM interface gives malaria programs a near real-time view of malaria and predicts risk at specific locations, such as health facility service areas, villages and schools. Overlaying data allows malaria control programs to identify high-risk areas that have insufficient levels of protection and better distribute their interventions….(More)”
How maps and machine learning are helping to eliminate malaria
Essay by Maurice E. Stucke and Ariel Ezrachi: “All you need to do is say,” a recent article proclaimed, “’I want a beer’ and Alexa will oblige. The future is now.” Advances in technology have seemingly increased our choices and opened markets to competition. As we migrate from brick-and-mortar shops to online commerce, we seemingly are getting more of what we desire at better prices and quality. And yet, behind the competitive façade, a more complex reality exists. We explore in our book “Virtual Competition” several emerging threats, namely algorithmic collusion, behavioural discrimination and abuses by dominant super-platforms. But the harm is not just economic. The potential anticompetitive consequences go beyond our pocketbooks. The toll will likely be on our privacy, well-being and democracy.
To see why, this Essay examines the emerging frontier of digital personal assistants. These helpers are being developed by the leading online platforms: Google Assistant, Apple’s Siri, Facebook’s M, and Amazon’s Alexa-powered Echo. These super-platforms are heavily investing to improve their offerings. For those of us who grew up watching The Jetsons, the prospect of our own personal helper might seem marvelous. And yet, despite their promise, can personalized digital assistants actually reduce our welfare? Might their rise reduce the number of gateways to the digital world, increase the market power of a few firms, and limit competition? And if so, what are the potential social, political, and economic concerns?
Our Essay seeks to address these questions. We show how network effects, big data and big analytics will likely undermine attempts to curtail a digital assistant’s power, and will likely allow it to operate below the regulatory and antitrust radar screens. As a result, rather than advance our overall welfare, these digital assistants – if left to their own devices – can undermine our welfare….(More)”
How Your Digital Helper May Undermine Your Welfare, and Our Democracy
Springwise: “There are few things more frustrating for cyclists than red lights, especially when riders have built up a good speed only to have to apply the brakes and lose all that momentum. To make things easier Dutch operation Springlab has designed a new system called Flo, which is being tested out in the city of Utrecht and has been set up to work alongside the city’s cycling lanes.
It works by using speed cameras placed 100 metres before each set of traffic lights, and calculates whether or not the cyclist should change speed to hit the green light. It uses animals to inform a cyclist if they should change speed, so a rabbit means speed up, a turtle means slow down, a cow means users are hitting the red light no matter what, and a simple thumbs up indicates the cyclist is doing the right speed.
It’s currently being tested out on Utrecht’s main road Amsterdamsestraatweg and all being well it’s hoped it’ll expand across the rest of the city and hopefully across Holland. Although it’s possible a nation so well known for its love of cycling will embrace such a system, whether or not it’ll go global is another matter. Another recent Dutch-based innovation ByCycling illustrates just how big cycling is in Holland, and in Poland a solar-powered glow in the dark bike lane is a genuinely impressive safety development….(More)”
New cycling system helps riders beat red lights