Open access: All human knowledge is there—so why can’t everybody access it?


 at ArsTechnica: “In 1836, Anthony Panizzi, who later became principal librarian of the British Museum, gave evidence before a parliamentary select committee. At that time, he was only first assistant librarian, but even then he had an ambitious vision for what would one day became the British Library. He told the committee:

I want a poor student to have the same means of indulging his learned curiosity, of following his rational pursuits, of consulting the same authorities, of fathoming the most intricate inquiry as the richest man in the kingdom, as far as books go, and I contend that the government is bound to give him the most liberal and unlimited assistance in this respect.

He went some way to achieving that goal of providing general access to human knowledge. In 1856, after 20 years of labour as Keeper of Printed Books, he had helped boost the British Museum’s collection to over half a million books, making it the largest library in the world at the time. But there was a serious problem: to enjoy the benefits of those volumes, visitors needed to go to the British Museum in London.

Imagine, for a moment, if it were possible to provide access not just to those books, but to all knowledge for everyone, everywhere—the ultimate realisation of Panizzi’s dream. In fact, we don’t have to imagine: it is possible today, thanks to the combined technologies of digital texts and the Internet. The former means that we can make as many copies of a work as we want, for vanishingly small cost; the latter provides a way to provide those copies to anyone with an Internet connection. The global rise of low-cost smartphones means that group will soon include even the poorest members of society in every country.

That is to say, we have the technical means to share all knowledge, and yet we are nowhere near providing everyone with the ability to indulge their learned curiosity as Panizzi wanted it.

What’s stopping us? That’s the central question that the “open access” movement has been asking, and trying to answer, for the last two decades. Although tremendous progress has been made, with more knowledge freely available now than ever before, there are signs that open access is at a critical point in its development, which could determine whether it will ever succeed in realising Panizzi’s plan.

Table of Contents

Code and the City


Book edited by Rob Kitchin, Sung-Yueh Perng: “Software has become essential to the functioning of cities. It is deeply embedded into the systems and infrastructure of the built environment and is entrenched in the management and governance of urban societies. Software-enabled technologies and services enhance the ways in which we understand and plan cities. It even has an effect on how we manage urban services and utilities.

Code and the City explores the extent and depth of the ways in which software mediates how people work, consume, communication, travel and play. The reach of these systems is set to become even more pervasive through efforts to create smart cities: cities that employ ICTs to underpin and drive their economy and governance. Yet, despite the roll-out of software-enabled systems across all aspects of city life, the relationship between code and the city has barely been explored from a critical social science perspective. This collection of essays seeks to fill that gap, and offers an interdisciplinary examination of the relationship between software and contemporary urbanism.

This book will be of interest to those researching or studying smart cities and urban infrastructure….(More)”.

Democracy in Decline: Rebuilding its Future


Book by Philip Kotler: “An examination by the ‘father of modern marketing’ into how well  a long cherished product (democracy) is satisfying the needs of its consumers (citizens), bringing conversation and solutions on how we can all do our bit to bring about positive change.

At a time where voting systems are flawed, fewer vote, major corporations fund campaigns and political parties battle it out, democracies are being seriously challenged and with that the prospects of a better world for all.

Philip Kotler identifies 14 shortcomings of today’s democracy and proposes potential remedies whilst encouraging readers to join the conversation, exercise their free speech and get on top of the issues that affect their lives regardless of nationality or political persuasion.

An accompanying website (www.democracyindecline.com) invites those interested to help find and publish thoughtful articles that aid our understanding of what is happening and what can be done to improve democracies around the world….(More)”

Customers, Users or Citizens? Inclusion, Spatial Data and Governance in the Smart City


Paper by Linnet Taylor, Christine Richter, Shazade Jameson and Carmen Perez de Pulgar: “This report discusses the use and governance of spatial data in Amsterdam’s smart city projects. How much does spatial data tell the city about its people, and how is that likely to change in the next decade? The project focuses especially on those who may be marginalised or challenged by increasing visibility due to the use of big data in the future smart city: various groups were interviewed including immigrants, children, sex workers, opt-outs of smart technologies, and technology developers. They were asked how they felt about their personal ‘data-sphere’, the level of data-awareness and the kind of consultation they would like to see as citizens of a smart city, and how they felt about increasing interaction between the city and private-sector partners around digital data. The report presents a social roadmap for the datafied city’s future, and addresses the question of how the city can build an inclusive and responsive spatial data governance infrastructure….(More)”

Digital Government: overcoming the systemic failure of transformation


Paul Waller and Vishanth Weerakkody: “This Working Paper contains propositions regarding the use of digital technology to “transform” government that significantly conflict with received wisdom in academia and governments across the world. It counters assertions made in countless political, official and commercial statements and reports produced over past decades….

The “transformation of government” has often been proposed as an objective of e-government; frequently presented as a phase in stage models following the provision online of information and transactions. Yet in literature or official documents there is no established definition of transformation as applied to government. Implicitly or explicitly, it mostly refers to a change in organisational form, signalled by the terms “joining-up” or “integration”, of government. In some work,

In some work, transformation is limited to changing processes or “services”— though “services” is a term unhelpfully applied to a multitude of entities. There is in academic or other literature little evidence of any type of “transformation” achieved beyond a change in an administrative process, nor a robust framework of benefits one might deliver. This begs the questions of what it actually means in reality and why it might be a desired goal.

In essence, what we aim to do in this paper is to develop a structured frame of reference for making sense of how information and communications technologies (ICT), in all their forms, really fit within the world of government and public administration — exactly the challenge set by Professor Christopher Hood in his 2007 paper:

“But we need to have a way of assessing current developments in administrative technologies with those of other eras, such as development of telephones, cars, radios, and fingerprinting in police work in the early part of the twentieth century, or of exact methods of measurement on excise tax collection in the eighteenth century. And if the analysis of the changes such developments bring is to amount to anything more than a breathless tour d’horizon of the latest technological gizmos in public policy (much though governments themselves have a liking for that sort of approach), it needs to be related to some foundational analysis that is, in some way, technology-free and rooted in the nature of government as a social and legal phenomenon.”

After a brief historical review, the paper starts by considering what governments and public administrations actually do: specifically, policy design and implementation through policy instruments. It redefines transformation in terms of changing the policy instrument set chosen to implement policy and sets out broad rationales for how and why ICT can enable this. It proposes a frame of reference of terminology, concepts and objects that enable the examination of not only such transformation, but e-government in general as it has developed over two decades. …(More)”

Connect the corporate dots to see true transparency


Gillian Tett at the Financial Times: “…In all this, a crucial point is often forgotten: simply amassing data will not solve the problem of transparency. What is also needed is a way for analysts to track the connections that exist between companies scattered across different national jurisdictions.

There are more than 45,000 companies listed on global stock exchanges and, according to Chris Taggart of OpenCorporates, an independent data company, there are between 250m and 400m unlisted groups. Many of these are listed on national registries but, since registries are extremely fragmented, it is very difficult for shareholders or regulators to form a complete picture of company activity.

It also creates financial stability risks. One reason why it is currently hard to track the scale of Chinese corporate debt, say, is that it is being issued by an opaque web of legal entities. Similarly, regulators struggled to cope with the fallout from the Lehman Brothers collapse in 2008 because the bank was operating almost 3,000 different legal entities around the world.

Is there a solution to this? A good place to start would be for governments to put their corporate registries online. Another crucial step would be for governments and companies to agree on a common standard for labelling legal entities, so that these can be tracked across borders.

Happily, work on that has begun: in 2014, the Global Legal Entity Identifier Foundation was created. It supports the implementation and use of “legal entity identifiers”, a data standard that identifies participants in financial transactions. Groups such as the Data Coalition in Washington DC are lobbying for laws that would force companies to use LEIs….However, this inter-governmental project is moving so slowly that the private sector may be a better bet. In recent years, companies such as Dun & Bradstreet have begun to amass proprietary information about complex corporate webs, and computer nerds are also starting to use the power of big data to join up the corporate dots in a public format.

OpenCorporates is a good example. Over the past five years, a dozen staff there have been painstakingly scraping national corporate registries to create a database designed to show how companies are connected around the world. This is far from complete but data from 100m entities have already been logged. And in the wake of the Panama Papers, more governments are coming on board — data from the Cayman Islands are currently being added and France is likely to collaborate soon.

Sadly, these moves will not deliver real transparency straight away. If you type “MIO” into the search box on the OpenCorporates website, you will not see a map of all of McKinsey’s activities — at least not yet.

The good news, however, is that with every data scrape, or use of an LEI, the picture of global corporate activity is becoming slightly less opaque thanks to the work of a hidden army of geeks. They deserve acclaim and support — even (or especially) from management consultants….(More)”

Three Things Great Data Storytellers Do Differently


Jake Porway at Stanford Social Innovation Review: “…At DataKind, we use data science and algorithms in the service of humanity, and we believe that communicating about our work using data for social impact is just as important as the work itself. There’s nothing worse than findings gathering dust in an unread report.

We also believe our projects should always start with a question. It’s clear from the questions above and others that the art of data storytelling needs some demystifying. But rather than answering each question individually, I’d like to pose a broader question that can help us get at some of the essentials: What do great data storytellers do differently and what can we learn from them?

1. They answer the most important question: So what?

Knowing how to compel your audience with data is more of an art than a science. Most people still have negative associations with numbers and statistics—unpleasant memories of boring math classes, intimidating technical concepts, or dry accounting. That’s a shame, because the message behind the numbers can be so enriching and enlightening.

The solution? Help your audience understand the “so what,” not the numbers. Ask: Why should someone care about your findings? How does this information impact them? My strong opinion is that most people actually don’t want to look at data. They need to trust that your methods are sound and that you’re reasoning from data, but ultimately they just want to know what it all means for them and what they should do next.

A great example of going straight to the “so what” is this beautiful, interactive visualization by Periscopic about gun deaths. It uses data sparingly but still evokes a very clear anti-gun message….

2. They inspire us to ask more questions.

The best data visualization helps people investigate a topic further, instead of drawing a conclusion for them or persuading them to believe something new.

For example, the nonprofit DC Action for Children was interested in leveraging publicly available data from government agencies and the US Census, as well as DC Action for Children’s own databases, to help policymakers, parents, and community members understand the conditions influencing child well-being in Washington, DC. We helped create a tool that could bring together data in a multitude of forms, and present it in a way that allowed people to delve into the topic themselves and uncover surprising truths, such as the fact that one out of every three kids in DC lives in a neighborhood without a grocery store….

3. They use rigorous analysis instead of just putting numbers on a page.

Data visualization isn’t an end goal; it’s a process. It’s often the final step in a long manufacturing chain, along which we poke, prod, and mold data to create that pretty graph.

Years ago, the New York City Department of Parks & Recreation (NYC Parks) approached us—armed with data about every single tree in the city, including when it was planted and how it was pruned—and wanted to know: Does pruning trees in one year reduce the number of hazardous tree conditions in the following year? This is one of the first things our volunteer data scientists came up with:

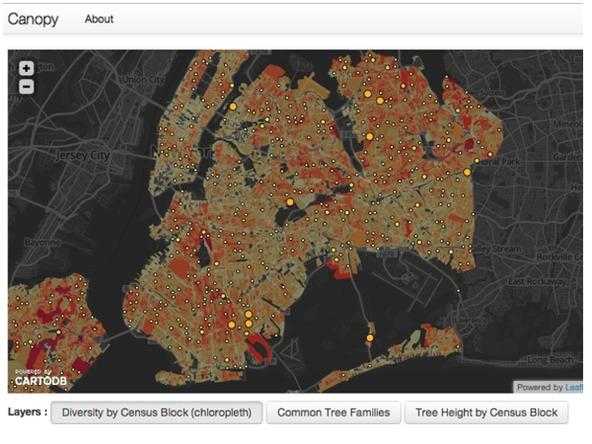
Visualization of NYC Parks’ Department data showing tree density in New York City.

This is a visualization of tree density New York—and it was met with oohs and aahs. It was interactive! You could see where different types of trees lived! It was engaging! But another finding that came out of this work arguably had a greater impact. Brian D’Alessandro, one of our volunteer data scientists, used statistical modeling to help NYC Parks calculate a number: 22 percent. It turns out that if you prune trees in New York, there are 22 percent fewer emergencies on those blocks than on the blocks where you didn’t prune. This number is helping the city become more effective by understanding how to best allocate its resources, and now other urban forestry programs are asking New York how they can do the same thing. There was no sexy visualization, no interactivity—just a rigorous statistical model of the world that’s shaping how cities protect their citizens….(More)”

Refugees and the Technology of Exile


David Lepeska in Wilson Quaterly: “While working for a Turkish tech firm, Akil learned how to program for mobile phones, and decided to make a smartphone app to help Syrians get all the information they need to build new lives in Turkey. In early 2014, he and a friend launched Gherbtna, named for an Arabic word referring to the loneliness of foreign exile….

About one-tenth of the 2.7 million Syrians in Turkey live in refugee camps. The rest fend for themselves, mostly in big cities. Now that they look set to stay in Turkey for some time, their need to settle and build stable, secure lives is much more acute. This may explain why downloads of Gherbtna more than doubled in the past six months. “We started this project to help people, and when we have reached all Syrian refugees, to help them find jobs, housing, whatever they need to build a new life in Turkey, then we have achieved our goal,” said Akil. “Our ultimate dream for Gherbtna is to reach all refugees around the world, and help them.”

Humanity is currently facing its greatest refugee crisis since World War II, with more than 60 million people forced from their homes. Much has been written about their use of technology — how Google Maps, WhatsApp, Facebook, and other tools have proven invaluable to the displaced and desperate. But helping refugees find their way, connect with family, or read the latest updates about route closings is one thing. Enabling them to grasp minute legal details, find worthwhile jobs and housing, enroll their children in school, and register for visas and benefits when they don’t understand the local tongue is another.

Due to its interpretation of the 1951 Geneva Convention on refugees, Ankara does not categorize Syrians in Turkey as refugees, nor does it accord them the pursuant rights and advantages. Instead, it has given them the unusual legal status of temporary guests, which means that they cannot apply for asylum and that Turkey can send them back to their countries of origin whenever it likes. What’s more, the laws and processes that apply to Syrians have been less than transparent and have changed several times. Despite all this — or perhaps because of it — government outreach has been minimal. Turkey has spent some $10 billion on refugees, and it distributes Arabic-language brochures at refugee camps and in areas with many Syrian residents. Yet it has created no Arabic-language website, app, or other online tool to communicate the relevant laws, permits, and legal changes to Syrians and other refugees.

Independent apps targeting these hurdles have begun to proliferate. Gherbtna’s main competitor in Turkey is the recently launched Alfanus (“Lantern” in Arabic), which its Syrian creators call an “Arab’s Guide to Turkey.” Last year, Souktel, a Palestinian mobile solutions firm, partnered with the international arm of the American Bar Association to launch a text-message service that provides legal information to Arabic speakers in Turkey. Norway is running a competition to develop a game-based learning app to educate Syrian refugee children. German programmers created Germany Says Welcome and the similar Welcome App Dresden. And Akil’s tech firm, Namaa Solutions, recently launched Tarjemly Live, a live translation app for English, Arabic, and Turkish.

But the extent to which these technologies have succeeded — have actually helped Syrians adjust and build new lives in Turkey, in particular — is in doubt. Take Gherbtna. The app has nine tools, including Video, Laws, Alerts, Find a Job, and “Ask me.” It offers restaurant and job listings; advice on getting a residence permit, opening a bank account, or launching a business; and much more. Like Souktel, Gherbtna has partnered with the American Bar Association to provide translations of Turkish laws. The app has been downloaded about 50,000 times, or by about 5 percent of Syrians in Turkey. (It is safe to assume, however, that a sizable percentage of refugees do not have smartphones.) Yet among two dozen Gherbtna users recently interviewed in Gaziantep and Istanbul — two Turkish cities with the most dense concentration of Syrians — most found it lacking. Many appreciate Gherbtna’s one-stop-shop appeal, but find little cause to keep using it. ”…(More)”

The trouble with Big Data? It is called the “recency bias”.


One of the problems with such a rate of information increase is that the present moment will always loom far larger than even the recent past. Imagine looking back over a photo album representing the first 18 years of your life, from birth to adulthood. Let’s say that you have two photos for your first two years. Assuming a rate of information increase matching that of the world’s data, you will have an impressive 2,000 photos representing the years six to eight; 200,000 for the years 10 to 12; and a staggering 200,000,000 for the years 16 to 18. That’s more than three photographs for every single second of those final two years.

The moment you start looking backwards to seek the longer view, you have far too much of the recent stuff and far too little of the old

This isn’t a perfect analogy with global data, of course. For a start, much of the world’s data increase is due to more sources of information being created by more people, along with far larger and more detailed formats. But the point about proportionality stands. If you were to look back over a record like the one above, or try to analyse it, the more distant past would shrivel into meaningless insignificance. How could it not, with so many times less information available?

Here’s the problem with much of the big data currently being gathered and analysed. The moment you start looking backwards to seek the longer view, you have far too much of the recent stuff and far too little of the old. Short-sightedness is built into the structure, in the form of an overwhelming tendency to over-estimate short-term trends at the expense of history.

To understand why this matters, consider the findings from social science about ‘recency bias’, which describes the tendency to assume that future events will closely resemble recent experience. It’s a version of what is also known as the availability heuristic: the tendency to base your thinking disproportionately on whatever comes most easily to mind. It’s also a universal psychological attribute. If the last few years have seen exceptionally cold summers where you live, for example, you might be tempted to state that summers are getting colder – or that your local climate may be cooling. In fact, you shouldn’t read anything whatsoever into the data. You would need to take a far, far longer view to learn anything meaningful about climate trends. In the short term, you’d be best not speculating at all – but who among us can manage that?

Short-term analyses aren’t only invalid – they’re actively unhelpful and misleading

The same tends to be true of most complex phenomena in real life: stock markets, economies, the success or failure of companies, war and peace, relationships, the rise and fall of empires. Short-term analyses aren’t only invalid – they’re actively unhelpful and misleading. Just look at the legions of economists who lined up to pronounce events like the 2009 financial crisis unthinkable right until it happened. The very notion that valid predictions could be made on that kind of scale was itself part of the problem.

It’s also worth remembering that novelty tends to be a dominant consideration when deciding what data to keep or delete. Out with the old and in with the new: that’s the digital trend in a world where search algorithms are intrinsically biased towards freshness, and where so-called link rot infests everything from Supreme Court decisions to entire social media services. A bias towards the present is structurally engrained in almost all the technology surrounding us, not least thanks to our habit of ditching most of our once-shiny machines after about five years.

What to do? This isn’t just a question of being better at preserving old data – although this wouldn’t be a bad idea, given just how little is currently able to last decades rather than years. More importantly, it’s about determining what is worth preserving in the first place – and what it means meaningfully to cull information in the name of knowledge.

What’s needed is something that I like to think of as “intelligent forgetting”: teaching our tools to become better at letting go of the immediate past in order to keep its larger continuities in view. It’s an act of curation akin to organising a photograph album – albeit with more maths….(More)

Your City Needs a Local Data Intermediary Now


Matt Lawyue and Kathryn Pettit at Next City: “Imagine if every community nationwide had access to their own data — data on which children are missing too many days of school, which neighborhoods are becoming unaffordable, or where more mothers are getting better access to prenatal care.

This is a reality in some areas, where neighborhood data is analyzed to evaluate community health and to promote development. Cleveland is studying cases of lead poisoning and the impact on school readiness and educational outcomes for children. Detroit is tracking the extent of property blight and abandonment.

But good data doesn’t just happen.

These activities are possible because of local intermediaries, groups that bridge the gap between data and local stakeholders: nonprofits, government agencies, foundations and residents. These groups access data that are often confidential and indecipherable to the public and make them accessible and useful. And with the support of the National Neighborhood Indicators Partnership (NNIP), groups around the country are championing community development at the local level.

Without a local data intermediary in Baltimore, we might know less about what happened there last year and why.

Freddie Gray’s death prompted intense discussion about police brutality and discrimination against African-Americans. But the Baltimore Neighborhood Indicators Alliance (BNIA) helped root this incident and others like it within a particular place, highlighting what can happen when disadvantage is allowed to accumulate over decades.

BNIA, an NNIP member, was formed in 2000 to help community organizations use data shared by government agencies. By the time of Gray’s death, BNIA had 15 years of data across more than 150 indicators that demonstrated clear socioeconomic disadvantages for residents of Gray’s neighborhood, Sandtown-Winchester. The neighborhood had a 34 percent housing vacancy rate and 23 percent unemployment. The neighborhood lacks highway access and is poorly served by public transit, leaving residents cut off from jobs and services.

With BNIA’s help, national and local media outlets, including the New York Times,MSNBC and the Baltimore Sun portrayed a community beset by concentrated poverty, while other Baltimore neighborhoods benefited from economic investment and rising incomes. BNIA data, which is updated yearly, has also been used to develop policy ideas to revitalize the neighborhood, from increasing the use of housing choice vouchers to tackling unemployment.

Local data intermediaries like BNIA harness neighborhood data to make underserved people and unresolved issues visible. They work with government agencies to access raw data (e.g., crime reports, property records, and vital statistics) and facilitate their use to improve quality of life for residents.

But it’s not easy. Uncovering useful, actionable information requires trust, technical expertise, knowledge of the local context and coordination among multiple stakeholders.

This is why the NNIP is vital. NNIP is a peer network of more than two dozen local data intermediaries and the Urban Institute, working to democratize data by building local capacity and planning joint activities. Before NNIP’s founding partners, there were no advanced information systems documenting and tracking neighborhood indicators. Since 1996, NNIP has been a platform for sharing best practices, providing technical assistance, managing cross-site projects and analysis, and expanding the outreach of local data intermediaries to national networks and federal agencies. The partnership continues to grow. In order to foster this capacity in more places, NNIP has just released a guide for local communities to start a data intermediary….(More)”