Bradi Heaberlin and Simon DeDeo at Future Internet: “Social norms have traditionally been difficult to quantify. In any particular society, their sheer number and complex interdependencies often limit a system-level analysis. One exception is that of the network of norms that sustain the online Wikipedia community. We study the fifteen-year evolution of this network using the interconnected set of pages that establish, describe, and interpret the community’s norms. Despite Wikipedia’s reputation for ad hocgovernance, we find that its normative evolution is highly conservative. The earliest users create norms that both dominate the network and persist over time. These core norms govern both content and interpersonal interactions using abstract principles such as neutrality, verifiability, and assume good faith. As the network grows, norm neighborhoods decouple topologically from each other, while increasing in semantic coherence. Taken together, these results suggest that the evolution of Wikipedia’s norm network is akin to bureaucratic systems that predate the information age….(More)”
How Big Data Creates False Confidence
Jesse Dunietz at Nautilus: “…A feverish push for “big data” analysis has swept through biology, linguistics, finance, and every field in between. Although no one can quite agree how to define it, the general idea is to find datasets so enormous that they can reveal patterns invisible to conventional inquiry. The data are often generated by millions of real-world user actions, such as tweets or credit-card purchases, and they can take thousands of computers to collect, store, and analyze. To many companies and researchers, though, the investment is worth it because the patterns can unlock information about anything from genetic disorders to tomorrow’s stock prices.
But there’s a problem: It’s tempting to think that with such an incredible volume of data behind them, studies relying on big data couldn’t be wrong. But the bigness of the data can imbue the results with a false sense of certainty. Many of them are probably bogus—and the reasons why should give us pause about any research that blindly trusts big data.
In the case of language and culture, big data showed up in a big way in 2011, when Google released itsNgrams tool. Announced with fanfare in the journal Science, Google Ngrams allowed users to search for short phrases in Google’s database of scanned books—about 4 percent of all books ever published!—and see how the frequency of those phrases has shifted over time. The paper’s authors heralded the advent of “culturomics,” the study of culture based on reams of data and, since then, Google Ngrams has been, well, largely an endless source of entertainment—but also a goldmine for linguists, psychologists, and sociologists. They’ve scoured its millions of books to show that, for instance, yes, Americans are becoming more individualistic; that we’re “forgetting our past faster with each passing year”; and that moral ideals are disappearing from our cultural consciousness.
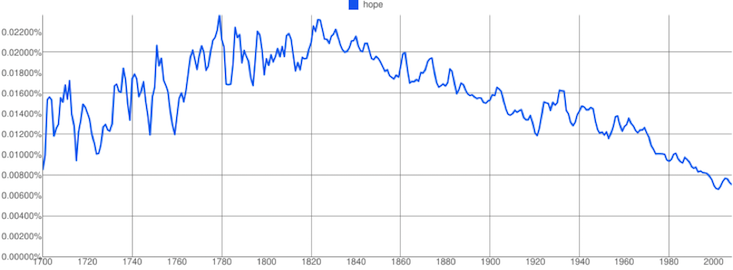
The problems start with the way the Ngrams corpus was constructed. In a study published last October, three University of Vermont researchers pointed out that, in general, Google Books includes one copy of every book. This makes perfect sense for its original purpose: to expose the contents of those books to Google’s powerful search technology. From the angle of sociological research, though, it makes the corpus dangerously skewed….
Even once you get past the data sources, there’s still the thorny issue of interpretation. Sure, words like “character” and “dignity” might decline over the decades. But does that mean that people care about morality less? Not so fast, cautions Ted Underwood, an English professor at the University of Illinois, Urbana-Champaign. Conceptions of morality at the turn of the last century likely differed sharply from ours, he argues, and “dignity” might have been popular for non-moral reasons. So any conclusions we draw by projecting current associations backward are suspect.
Of course, none of this is news to statisticians and linguists. Data and interpretation are their bread and butter. What’s different about Google Ngrams, though, is the temptation to let the sheer volume of data blind us to the ways we can be misled.
This temptation isn’t unique to Ngrams studies; similar errors undermine all sorts of big data projects. Consider, for instance, the case of Google Flu Trends (GFT). Released in 2008, GFT would count words like “fever” and “cough” in millions of Google search queries, using them to “nowcast” how many people had the flu. With those estimates, public health officials could act two weeks before the Centers for Disease Control could calculate the true numbers from doctors’ reports.
When big data isn’t seen as a panacea, it can be transformative.
Initially, GFT was claimed to be 97 percent accurate. But as a study out of Northeastern University documents, that accuracy was a fluke. First, GFT completely missed the “swine flu” pandemic in the spring and summer of 2009. (It turned out that GFT was largely predicting winter.) Then, the system began to overestimate flu cases. In fact, it overshot the peak 2013 numbers by a whopping 140 percent. Eventually, Google just retired the program altogether.
So what went wrong? As with Ngrams, people didn’t carefully consider the sources and interpretation of their data. The data source, Google searches, was not a static beast. When Google started auto-completing queries, users started just accepting the suggested keywords, distorting the searches GFT saw. On the interpretation side, GFT’s engineers initially let GFT take the data at face value; almost any search term was treated as a potential flu indicator. With millions of search terms, GFT was practically guaranteed to over-interpret seasonal words like “snow” as evidence of flu.
But when big data isn’t seen as a panacea, it can be transformative. Several groups, like Columbia University researcher Jeffrey Shaman’s, for example, have outperformed the flu predictions of both the CDC and GFT by using the former to compensate for the skew of the latter. “Shaman’s team tested their model against actual flu activity that had already occurred during the season,” according to the CDC. By taking the immediate past into consideration, Shaman and his team fine-tuned their mathematical model to better predict the future. All it takes is for teams to critically assess their assumptions about their data….(More)
Secret Admirers: An Empirical Examination of Information Hiding and Contribution Dynamics in Online Crowdfunding
Gordon Burtch et al: “Individuals’ actions in online social contexts are growing increasingly visible and traceable. Many online platforms account for this by providing users with granular control over when and how their identity or actions are made visible to peers. However, little work has sought to understand the effect that a user’s decision to conceal information might have on observing peers, who are likely to refer to that information when deciding on their own actions. We leverage a unique impression-level dataset from one of the world’s largest online crowdfunding platforms, where contributors are given the option to conceal their username or contribution amount from public display, with each transaction. We demonstrate that when campaign contributors elect to conceal information, it has a negative influence on subsequent visitors’ likelihood of conversion, as well as on their average contributions, conditional on conversion. Moreover, we argue that social norms are an important driver of information concealment, providing evidence of peer influence in the decision to conceal. We discuss the implications of our results for the provision of online information hiding mechanisms, as well as the design of crowdfunding platforms and electronic markets more generally….(More)”
Mexico City is crowdsourcing its new constitution using Change.org in a democracy experiment
Ana Campoy at Quartz: “Mexico City just launched a massive experiment in digital democracy. It is asking its nearly 9 million residents to help draft a new constitution through social media. The crowdsourcing exercise is unprecedented in Mexico—and pretty much everywhere else.
as locals are known, can petition for issues to be included in the constitution through Change.org (link inSpanish), and make their case in person if they gather more than 10,000 signatures. They can also annotate proposals by the constitution drafters via PubPub, an editing platform (Spanish) similar to GoogleDocs.
The idea, in the words of the mayor, Miguel Angel Mancera, is to“bestow the constitution project (Spanish) with a democratic,progressive, inclusive, civic and plural character.”
There’s a big catch, however. The constitutional assembly—the body that has the final word on the new city’s basic law—is under no obligation to consider any of the citizen input. And then there are the practical difficulties of collecting and summarizing the myriad of views dispersed throughout one of the world’s largest cities.
That makes Mexico City’s public-consultation experiment a big test for the people’s digital power, one being watched around the world.Fittingly, the idea of crowdsourcing a constitution came about in response to an attempt to limit people power.
Fittingly, the idea of crowdsourcing a constitution came about in response to an attempt to limit people power.
For decades, city officials had fought to get out from under the thumb of the federal government, which had the final word on decisions such as who should be the city’s chief of police. This year, finally, they won a legal change that turns the Distrito Federal (federal district), similar to the US’s District of Columbia, into Ciudad de México (Mexico City), a more autonomous entity, more akin to a state. (Confusingly, it’s just part of the larger urban area also colloquially known as Mexico City, which spills into neighboring states.)
However, trying to retain some control, the Mexican congress decided that only 60% of the delegates to the city’s constitutional assembly would be elected by popular vote. The rest will be assigned by the president, congress, and Mancera, the mayor. Mancera is also the only one who can submit a draft constitution to the assembly.
Mancera’s response was to create a committee of some 30 citizens(Spanish), including politicians, human-rights advocates, journalists,and even a Paralympic gold medalist, to write his draft. He also calledfor the development of mechanisms to gather citizens’ “aspirations,values, and longing for freedom and justice” so they can beincorporated into the final document.
The mechanisms, embedded in an online platform (Spanish) that offersvarious ways to weigh in, were launched at the end of March and willcollect inputs until September 1. The drafting group has until themiddle of that month to file its text with the assembly, which has toapprove the new constitution by the end of January.
An experiment with few precedents
Mexico City didn’t have a lot of examples to draw on, since not a lot ofplaces have experience with crowdsourcing laws. In the US, a few locallawmakers have used Wiki pages and GitHub to draft bills, says MarilynBautista, a lecturer at Stanford Law School who has researched thepractice. Iceland—with a population some 27 times smaller than MexicoCity’s—famously had its citizens contribute to its constitution withinput from social media. The effort failed after the new constitution gotstuck in parliament.
In Mexico City, where many citizens already feel left out, the first bighurdle is to convince them it’s worth participating….
Then comes the task of making sense of the cacophony that will likelyemerge. Some of the input can be very easily organized—the results ofthe survey, for example, are being graphed in real time. But there could be thousands of documents and comments on the Change.org petitionsand the editing platform.
Ideas are grouped into 18 topics, such as direct democracy,transparency and economic rights. They are prioritized based on theamount of support they’ve garnered and how relevant they are, saidBernardo Rivera, an adviser for the city. Drafters get a weekly deliveryof summarized citizen petitions….

The most elaborate part of the system is PubPub, an open publishing platform similar to Google Docs, which is based on a project originally developed by MIT’s Media Lab. The drafters are supposed to post essays on how to address constitutional issues, and potentially, the constitution draft itself, once there is one. Only they—or whoever they authorize—will be able to reword the original document.
User comments and edits are recorded on a side panel, with links to the portion of text they refer to. Another screen records every change, so everyone can track which suggestions have made it into the text. Members of the public can also vote comments up or down, or post their own essays….(More).
7 projects that state and local governments can reuse
There are a number of open source projects that 18F has worked on that could work particularly well at any level of government. We’re highlighting seven below:
Public website analytics
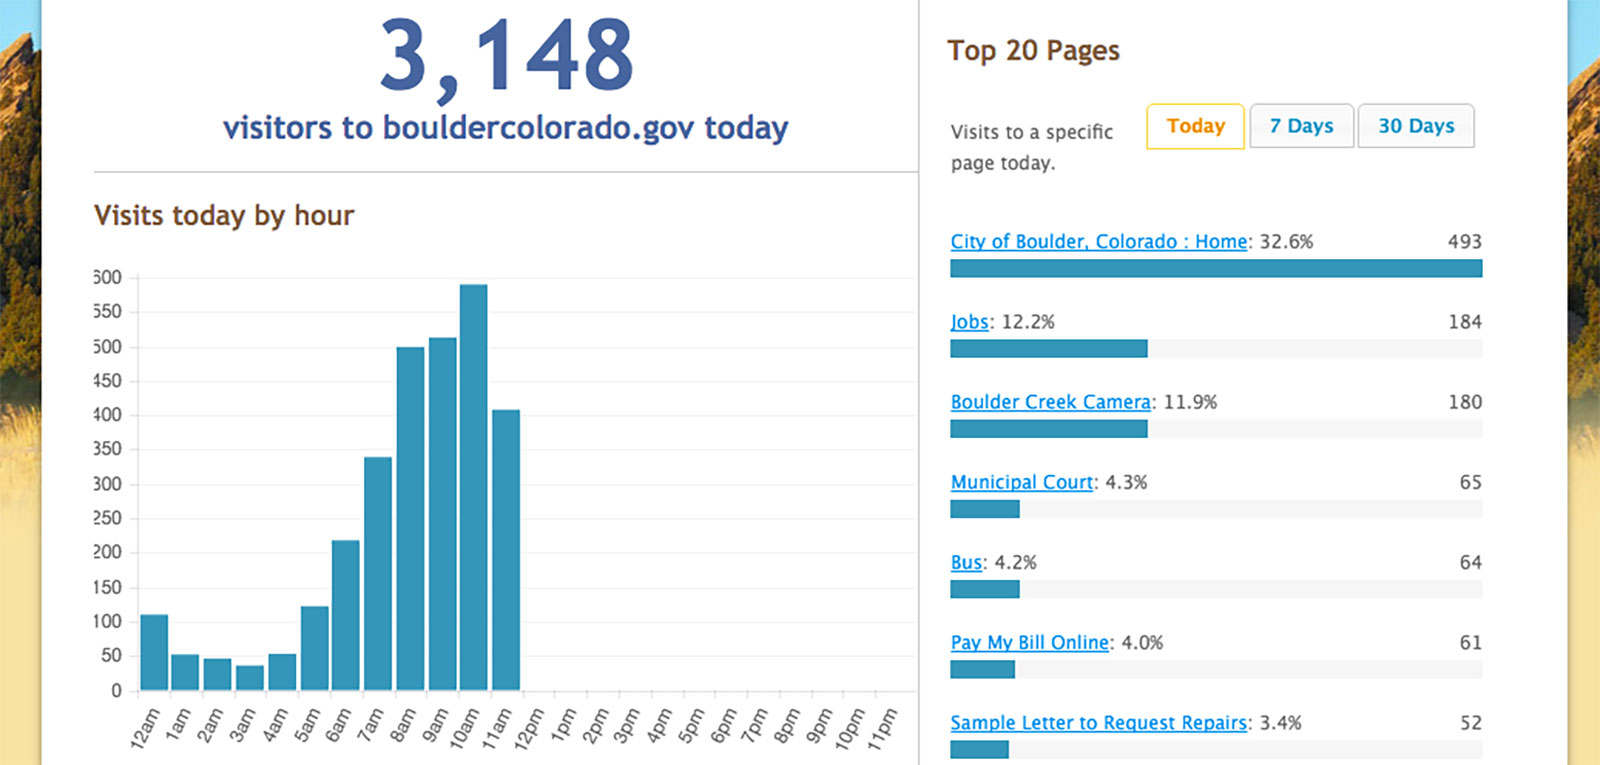
We worked with the Digital Analytics Program, the U.S. Digital Service (USDS), and the White House to build and host a dashboard showing real-time U.S. federal government web traffic. This helps staff and the public learn about how people use government websites. The dashboard itself is open source and can be adapted for a state or local government. We recently interviewed folks from Philadelphia, Boulder, and the state of Tennessee about how they’ve adapted the analytics dashboard for their own use.
Quick mini-sites for content
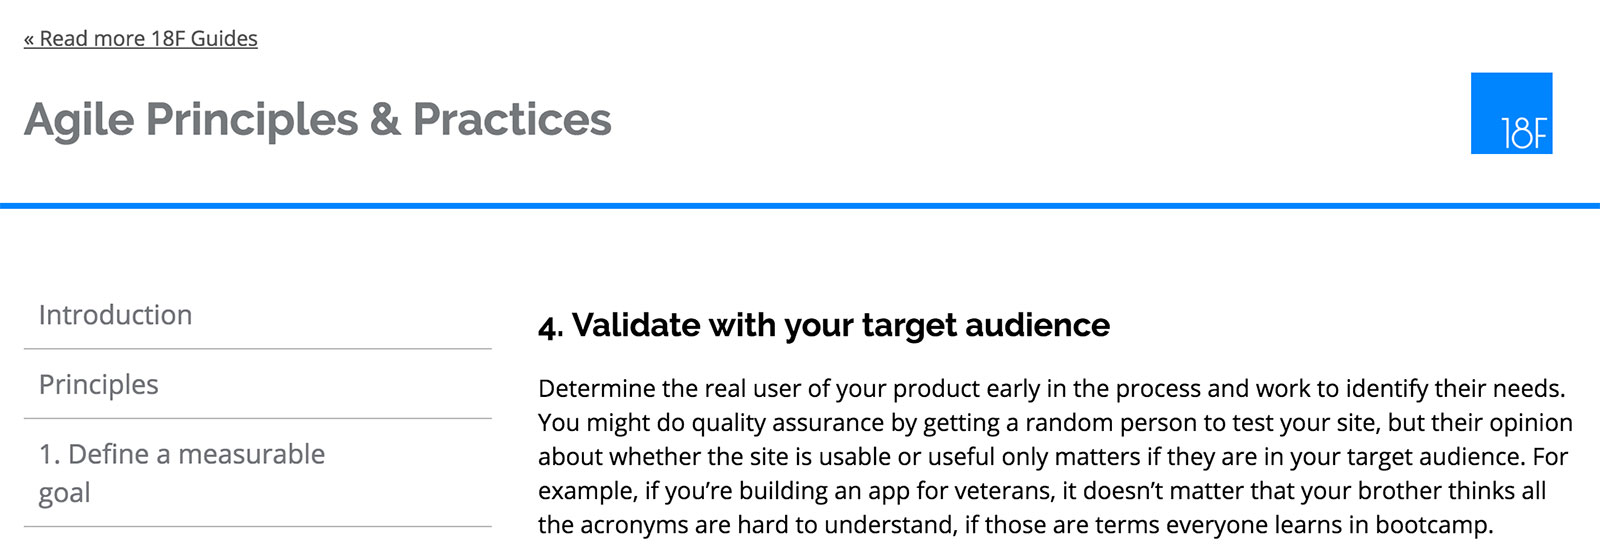
We built a responsive, accessible website template (based on open source work by the Consumer Financial Protection Bureau) that we use primarily for documentation and guides. You can take the website template, adapt the colors and fonts to reflect your own style template, and have an easy way to release notes about a project. We’ve used this template to write a guide on accessibility in government, content guidelines, and a checklist for what needs to take place before we release software. You’re also welcome to take our content and adapt it for your own needs — what we write is in the public domain.
Insight into how people interact with government
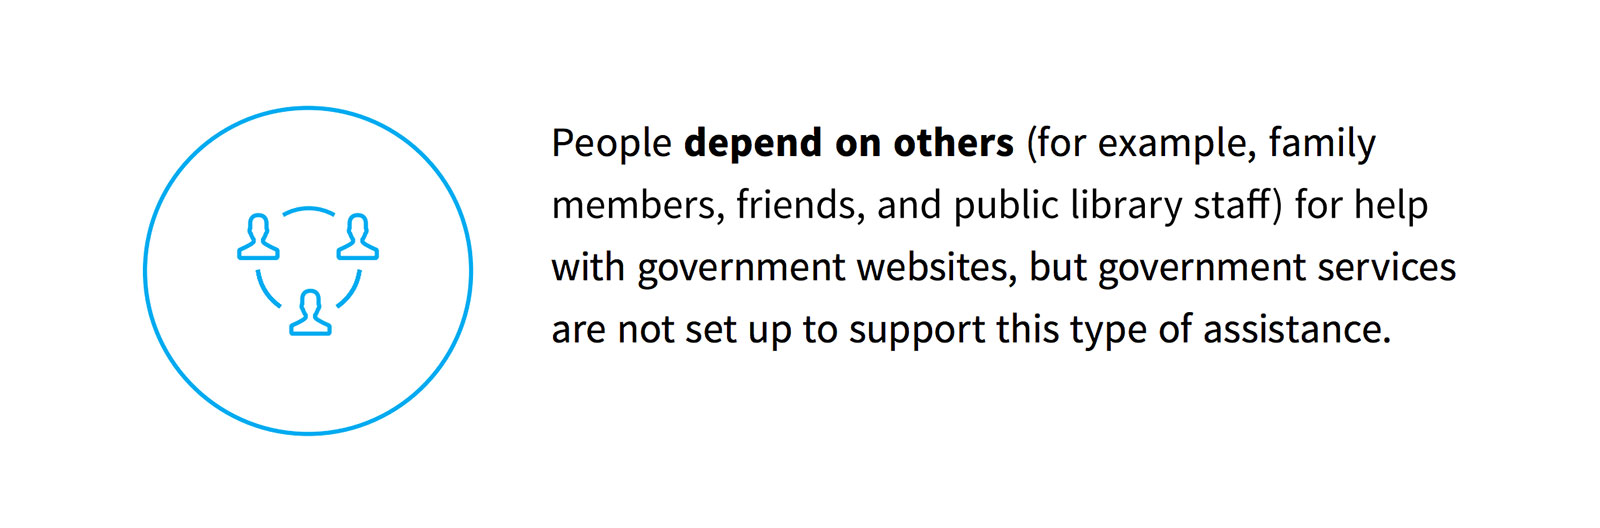
Over the last several months, staff from General Service Administration’s USAGov and 18F teams have been talking to Americans around the country about their interactions with the federal government. The goal of the research was to identify and create cross-agency services and resources to improve how the government interacts with the public. Earlier this month, we published all of our research. You can read the full report with findings or explore what we learned on the 18F blog.
Market research for procurement
We developed a tool that helps you easily conduct market research across a number of categories for acquiring professional labor. You can read about how the city of Boston is using the tool to conduct market research.
Vocabulary for user-centered design
We released a deck of method cards that help research and design teams communicate a shared vocabulary across teams and agencies.
Task management
We recently developed a checklist program that help users manage complex to-do lists. One feature: checklist items deadlines can be set according to a fixed date or relative to completion of other items. This means you can create checklist for all new employees, for example, and say “Task five should be completed four days after task four,” whenever task four is completed by an employee.
Help small businesses find opportunities
FBOpen is a set of open source tools to help small businesses search for opportunities to work with the U.S. government. FBOpen presents an Application Programming Interface (API) to published Federal contracting opportunities, as well as implementing a beautiful graphical user interface to the same opportunities.
Anyone who wishes to may reuse this code to create their own website, free of charge and unencumbered by obligations….(More)”
Applying Behavioral Economics to Public Health Policy
Jennifer L. Matjasko, et al in the American Journal of Preventive Medicine: “From the beginning, health has been recognized as a fertile area for applying nudges. The subtitle of the bookNudge is Improving Decisions about Health, Wealth, and Happiness. In their discussion of health behaviors, Thaler and Sunstein propose new nudges in health, such as simplifying decision making in Medicare. In fact, section 1511 of the Affordable Care Act requires large employers to automatically enroll workers into health insurance; similar to the previous example on organ donation, this switched from an opt-in to an opt-out system in order to harness the power of defaults. We will provide examples in which concepts from behavioral economics were applied to public health policy and led to improvements in health attitudes and behaviors. A summary of these applications is provided in Table 1.
Nudges can be effective because people are influenced by stimuli that are visible and new; thus, at least in theory, small changes can lead to behavior modification. Several studies have found that simply prompting (nudging) individuals to make a plan increases the probability of the subject eventually engaging in the prompted health behavior, such as immunizations, healthy eating, and cancer screening. For example, one study found that e-mailing patients appointment times and locations for their next influenza vaccination increased vaccination rates by 36%. Another intervention was even simpler. Rather than assigning a date and time for the patient to be vaccinated, patients were simply mailed a card that asked the patient to write down the day or day and time they planned to get the influenza vaccine (they were also sent the day and time of the free influenza vaccine clinics). Relative to a control condition (people who only received the information about the day and time of the clinics), those prompted to write down the day and time they planned to get the influenza vaccine were 4.2 percentage points (12.7%) more likely to receive the vaccine at those clinics. Those prompted to write down the date but not the time were not significantly more likely to be vaccinated at the clinics. Decision heuristics, such as highlighting consensus, may also help. Highlighting descriptive norms among a group of trusted experts, or priming (e.g., that 90% of doctors agree that vaccines are safe) can significantly reduce public concern about (childhood) vaccines and promote intentions to vaccinate.
The significant influence of framing has been demonstrated in many public health domains, such as messaging about blood transfusion, smoking cessation, sunscreen use, and mammography utilization. In particular, gains-framed messages (i.e., emphasizing the health gains of a behavior or treatment) were more likely to have a positive impact on the attitudes toward activities targeting prevention (e.g., blood safety, sunscreen use, smoking cessation). Loss-based messages may be more effective at encouraging screening behaviors, such as mammography screening. This points to the importance of testing messages for the uptake of preventive services among varying subgroups, many of which are now covered without cost-sharing as a result of the coverage of preventive services mandated in the Affordable Care Act.
Detailed Illustrative Examples (More)”
The “Social Side” of Public Policy: Monitoring Online Public Opinion and Its Mobilization During the Policy Cycle
Andrea Ceron and Fedra Negri in Policy & Internet: “This article addresses the potential role played by social media analysis in promoting interaction between politicians, bureaucrats, and citizens. We show that in a “Big Data” world, the comments posted online by social media users can profitably be used to extract meaningful information, which can support the action of policymakers along the policy cycle. We analyze Twitter data through the technique of Supervised Aggregated Sentiment Analysis. We develop two case studies related to the “jobs act” labor market reform and the “#labuonascuola” school reform, both formulated and implemented by the Italian Renzi cabinet in 2014–15. Our results demonstrate that social media data can help policymakers to rate the available policy alternatives according to citizens’ preferences during the formulation phase of a public policy; can help them to monitor citizens’ opinions during the implementation phase; and capture stakeholders’ mobilization and de-mobilization processes. We argue that, although social media analysis cannot replace other research methods, it provides a fast and cheap stream of information that can supplement traditional analyses, enhancing responsiveness and institutional learning….(More)”
Science to the People
David Lang on how citizen science bridges the gap between science and society: “It’s hard to find a silver lining in the water crisis in Flint, Michigan. The striking images of jugs of brown water being held high in protest are a symbol of institutional failure on a grand scale. It’s a disaster. But even as questions of accountability and remedy remain unanswered, there is already one lesson we can take away: Citizen science can be used as a powerful tool to build (or rebuild) the public’s trust in science.
Because the other striking image from Flint is this: Citizen-scientists sampling and testing their own water, from their homes and neighborhoods,and reporting the results as scientific data. Dr. Marc Edwards is the VirginiaTech civil engineering professor who led the investigation into the lead levels in Flint’s water supply, and in a February 2016 interview with TheChronicle of Higher Education, he gave an important answer about the methods his team used to obtain the data: “Normal people really appreciate good science that’s done in their interest. They stepped forward as citizen-scientists to explore what was happening to them and to their community,we provided some funding and the technical and analytical expertise, and they did all the work. I think that work speaks for itself.”
It’s a subtle but important message: The community is rising up and rallying by using science, not by reacting to it. Other scientists trying to highlight important issues and influence public opinion would do well to take note, because there’s a disconnect between what science reports and what the general public chooses to believe. For instance, 97 percent of scientists agree that the world’s climate is warming, likely due to human activities. Yet only 70 percent of Americans believe that global warming is real. Many of the most important issues of our time have the same, growing gap between scientific and societal consensus: genetically modified foods, evolution,vaccines are often widely distrusted or disputed despite strong, positive scientific evidence…..
The good news is that we’re learning. Citizen science — the growing trend of involving non-professional scientists in the process of discovery — is proving to be a supremely effective tool. It now includes far more than birders and backyard astronomers, its first amateur champions. Over the past few years,the discipline has been gaining traction and popularity in academic circles too. Involving groups of amateur volunteers is now a proven strategy for collecting data over large geographic areas or over long periods of time.Online platforms like Zooniverse have shown that even an untrained human eye can spot anomalies in everything from wildebeest migrations to Martiansurfaces. For certain types of research, citizen science just works.
While a long list of peer-reviewed papers now backs up the efficacy of citizen science, and a series of papers has shown its positive impact on students’ view of science, we’re just beginning to understand the impact of that participation on the wider perception of science. Truthfully, for now,most of what we know so far about its public impact is anecdotal, as in the work in Flint, or even on our online platform for explorers, OpenExplorer….It makes sense that citizen science should affect public perception of science.The difference between “here are the results of a study” and “please help
It makes sense that citizen science should affect public perception of science.The difference between “here are the results of a study” and “please help us in the process of discovery” is profound. It’s the difference between a rote learning moment and an immersive experience. And even if not everyone is getting involved, the fact that this is possible and that some members of a community are engaging makes science instantly more relatable. It creates what Tim O’Reilly calls an “architecture of participation.” Citizen scientists create the best interface for convincing the rest of the populace.
A recent article in Nature argued that the DIY biology community was, in fact, ahead of the scientific establishment in terms of proactively thinking about the safety and ethics of rapidly advancing biotechnology tools. They had to be. For those people opening up community labs so that anyone can come and participate, public health issues can’t be pushed aside or dealt with later. After all, they are the public that will be affected….(More)”
The Open Data Barometer (3rd edition)
The Open Data Barometer: “Once the preserve of academics and statisticians, data has become a development cause embraced by everyone from grassroots activists to the UN Secretary-General. There’s now a clear understanding that we need robust data to drive democracy and development — and a lot of it.
Last year, the world agreed the Sustainable Development Goals (SDGs) — seventeen global commitments that set an ambitious agenda to end poverty, fight inequality and tackle climate change by 2030. Recognising that good data is essential to the success of the SDGs, the Global Partnership for Sustainable Development Data and the International Open Data Charter were launched as the SDGs were unveiled. These alliances mean the “data revolution” now has over 100 champions willing to fight for it. Meanwhile, Africa adopted the African Data Consensus — a roadmap to improving data standards and availability in a region that has notoriously struggled to capture even basic information such as birth registration.
But while much has been made of the need for bigger and better data to power the SDGs, this year’s Barometer follows the lead set by the International Open Data Charter by focusing on how much of this data will be openly available to the public.
Open data is essential to building accountable and effective institutions, and to ensuring public access to information — both goals of SDG 16. It is also essential for meaningful monitoring of progress on all 169 SDG targets. Yet the promise and possibilities offered by opening up data to journalists, human rights defenders, parliamentarians, and citizens at large go far beyond even these….
At a glance, here are this year’s key findings on the state of open data around the world:
- Open data is entering the mainstream.The majority of the countries in the survey (55%) now have an open data initiative in place and a national data catalogue providing access to datasets available for re-use. Moreover, new open data initiatives are getting underway or are promised for the near future in a number of countries, including Ecuador, Jamaica, St. Lucia, Nepal, Thailand, Botswana, Ethiopia, Nigeria, Rwanda and Uganda. Demand is high: civil society and the tech community are using government data in 93% of countries surveyed, even in countries where that data is not yet fully open.
- Despite this, there’s been little to no progress on the number of truly open datasets around the world.Even with the rapid spread of open government data plans and policies, too much critical data remains locked in government filing cabinets. For example, only two countries publish acceptable detailed open public spending data. Of all 1,380 government datasets surveyed, almost 90% are still closed — roughly the same as in the last edition of the Open Data Barometer (when only 130 out of 1,290 datasets, or 10%, were open). What is more, much of the approximately 10% of data that meets the open definition is of poor quality, making it difficult for potential data users to access, process and work with it effectively.
- “Open-washing” is jeopardising progress. Many governments have advertised their open data policies as a way to burnish their democratic and transparent credentials. But open data, while extremely important, is just one component of a responsive and accountable government. Open data initiatives cannot be effective if not supported by a culture of openness where citizens are encouraged to ask questions and engage, and supported by a legal framework. Disturbingly, in this edition we saw a backslide on freedom of information, transparency, accountability, and privacy indicators in some countries. Until all these factors are in place, open data cannot be a true SDG accelerator.
- Implementation and resourcing are the weakest links.Progress on the Barometer’s implementation and impact indicators has stalled or even gone into reverse in some cases. Open data can result in net savings for the public purse, but getting individual ministries to allocate the budget and staff needed to publish their data is often an uphill battle, and investment in building user capacity (both inside and outside of government) is scarce. Open data is not yet entrenched in law or policy, and the legal frameworks supporting most open data initiatives are weak. This is a symptom of the tendency of governments to view open data as a fad or experiment with little to no long-term strategy behind its implementation. This results in haphazard implementation, weak demand and limited impact.
- The gap between data haves and have-nots needs urgent attention.Twenty-six of the top 30 countries in the ranking are high-income countries. Half of open datasets in our study are found in just the top 10 OECD countries, while almost none are in African countries. As the UN pointed out last year, such gaps could create “a whole new inequality frontier” if allowed to persist. Open data champions in several developing countries have launched fledgling initiatives, but too often those good open data intentions are not adequately resourced, resulting in weak momentum and limited success.
- Governments at the top of the Barometer are being challenged by a new generation of open data adopters. Traditional open data stalwarts such as the USA and UK have seen their rate of progress on open data slow, signalling that new political will and momentum may be needed as more difficult elements of open data are tackled. Fortunately, a new generation of open data adopters, including France, Canada, Mexico, Uruguay, South Korea and the Philippines, are starting to challenge the ranking leaders and are adopting a leadership attitude in their respective regions. The International Open Data Charter could be an important vehicle to sustain and increase momentum in challenger countries, while also stimulating renewed energy in traditional open data leaders….(More)”
Foreign Policy has lost its creativity. Design thinking is the answer.
Elizabeth Radziszewski at The Wilson Quaterly: “Although the landscape of threats has changed in recent years, U.S. strategies bear striking resemblance to the ways policymakers dealt with crises in the past. Whether it involves diplomatic overtures, sanctions, bombing campaigns, or the use of special ops and covert operations, the range of responses suffers from innovation deficit. Even the use of drones, while a new tool of warfare, is still part of the limited categories of responses that focus mainly on whether or not to kill, cooperate, or do nothing. To meet the evolving nature of threats posed by nonstate actors such as ISIS, the United States needs a strategy makeover — a creative lift, so to speak.
Sanctions, diplomacy, bombing campaigns, special ops, covert operations — the range of our foreign policy responses suffers from an innovation deficit.
Enter the business world. Today’s top companies face an increasingly competitive marketplace where innovative approaches to product and service development are a necessity. Just as the market has changed for companies since the forces of globalization and the digital economy took over, so has the security landscape evolved for the world’s leading hegemon. Yet the responses of top businesses to these changes stand in stark contrast to the United States’ stagnant approaches to current national security threats. Many of today’s thriving businesses have embraced design thinking (DT), an innovative process that identifies consumer needs through immersive ethnographic experiences that are melded with creative brainstorming and quick prototyping.
What would happen if U.S. policymakers took cues from the business world and applied DT in policy development? Could the United States prevent the threats from metastasizing with more proactive rather than reactive strategies — by discovering, for example, how ideas from biology, engineering, and other fields could help analysts inject fresh perspective into tired solutions? Put simply, if U.S. policymakers want to succeed in managing future threats, then they need to start thinking more like business innovators who integrate human needs with technology and economic feasibility.
In his 1969 book The Sciences of the Artificial, Herbert Simon made the first connection between design and a way of thinking. But it was not until the 1980s and 1990s that Stanford scientists began to see the benefits of design practices used by industrial designers as a method for creative thinking. At the core of DT is the idea that solving a challenge requires a deeper understanding of the problem’s true nature and the processes and people involved. This approach contrasts greatly with more standard innovation styles, where a policy solution is developed and then resources are used to fit the solution to the problem. DT reverses the order.
DT encourages divergent thinking, the process of generating many ideas before converging to select the most feasible ones, including making connections between different-yet-related worlds. Finally, the top ideas are quickly prototyped and tested so that early solutions can be modified without investing many resources and risking the biggest obstacle to real innovation: the impulse to try fitting an idea, product, policy to the people, rather of the other way around…
If DT has reenergized the innovative process in the business and nonprofit sector, a systematic application of its methodology could just as well revitalize U.S. national security policies. Innovation in security and foreign policy is often framed around the idea of technological breakthroughs. Thanks toDefense Advanced Research Projects Agency (DARPA), the Department of Defense has been credited with such groundbreaking inventions as GPS, the Internet, and stealth fighters — all of which have created rich opportunities to explore new military strategies. Reflecting this infatuation with technology, but with a new edge, is Defense Secretary Ashton Carter’s unveiling of the Defense Innovation Unit Experimental, an initiative to scout for new technologies, improve outreach to startups, and form deeper relationships between the Pentagon and Silicon Valley. The new DIUE effort signals what businesses have already noticed: the need to be more flexible in establishing linkages with people outside of the government in search for new ideas.
Yet because the primary objective of DIUE remains technological prowess, the effort alone is unlikely to drastically improve the management of national security. Technology is not a substitute for an innovative process. When new invention is prized as the sole focus of innovation, it can, paradoxically, paralyze innovation. Once an invention is adopted, it is all too tempting to mold subsequent policy development around emergent technology, even if other solutions could be more appropriate….(More)”