Stefaan Verhulst
Gavin Hayman at the Huffington Post: “This week the British Prime Minister David Cameron is hosting an international anti-corruption summit. The scourge of anonymous shell companies and hidden identities rightly seizes the public’s imagination. We can all picture the suitcases of cash and tropical islands involved. As well as acting on offshore and onshore money laundering havens, world leaders at the summit should also be asking themselves where all this money is being stolen from in the first place.
The answer is mostly from public contracting: government spending through private companies to deliver works, goods and services to citizens. It is technical, dull and universally obscure. But it is the single biggest item of spending by government – amounting to a staggering $9,500,000,000,000 each year. This concentration of money, government discretion, and secrecy makes public contracting so vulnerable to corruption. Data on prosecutions tracked by the OECD Anti-Bribery Convention shows that roughly 60% of bribes were paid to win public contracts.
Corruption in contracting deprives ordinary people of vital goods and services, and sometimes even kills: I was one of many Londoners moved by Ai Wei Wei’s installation that memorialised the names of thousands of children killed in China’s Sichuan earthquake in 2008. Their supposed earthquake-proof schools collapsed on them like tofu.
Beyond corruption, inefficiency and mismanagement of public contracts cost countries billions. Governments just don’t seem to know what they are buying, when, from whom, and whether they got a good price.
This problem can be fixed. But it will require a set of innovations best described as open contracting: using accessible open data and better engagement so that citizens, government and business can follow the money in government contracts from planning to tendering to performance and closure. The coordination required can be hard work but it is achievable: any country can make substantial progress on open contracting with some political leadership. My organisation supports an open data standard and a free global helpdesk to assist governments, civil society, and business in this transition….(More)”
David Bornstein in the New York Times: “…But there is a problem: Demand for organ transplants vastly outstrips supply, as my colleague Tina Rosenberg has reported. In 2015 in the United States, there were only about 9,000 deceased donors (each of whom can save up to eight lives) and 6,000 living donors (who most often donate a kidney or liver lobe). Today, more than 121,000 people are on waiting lists, roughly 100,000 for kidney transplants, 15,000 for livers, and 4,000 for hearts. And the lists keep getting longer — 3,000 people are added to the kidney list each month. Last year, more than 4,000 people died while waiting for a new kidney; 3,600 dropped off the waiting list because they became too sick to qualify for a transplant.
Although 95 percent of Americans support organ donation, fewer than half of American adults are registered as donors. Research suggests that the number who donate organs after death could be increased greatly. Moreover, surveys indicate untapped support for living donation, too; nearly one in four people have told pollsters they would be willing to donate a kidney to save the life of a friend, community member or stranger. “If one in 10,000 Americans decided to donate each year, there wouldn’t be a shortage,” said Josh Morrison, who donated a kidney to a stranger and founded WaitList Zero, an organization that works to increase living kidney donation.
What could be done to harness people’s generous impulses more effectively to save lives?
One group attacking the question is Organize, which was founded in 2014 by Rick Segal’s son Greg, and Jenna Arnold, a media producer and educator who has worked with MTV and the United Nations in engaging audiences in social issues. Organize uses technology, open data and insights from behavioral economics to simplify becoming an organ donor.
This approach is shaking up longstanding assumptions.
For example, in the last four decades, people have most often been asked to register as an organ donor as part of renewing or obtaining a driver’s license. This made sense in the 1970s, when the nation’s organ procurement system was being set up, says Blair Sadler, the former president and chief executive of Rady Children’s Hospital in San Diego. He helped draft theUniform Anatomical Gift Act in 1967, which established a national legal framework for organ donation. “Health care leaders were asking, ‘How do we make this more routine?’” he recalled. “It’s hard to get people to put it in their wills. Oh, there’s a place where people have to go every five years” — their state Department of Motor Vehicles.
Today, governments allow individuals to initiate registrations online, but the process can be cumbersome. For example, New York State required me to fill out a digital form on my computer, then print it out and mail it to Albany. Donate Life America, by contrast, allows individuals to register online as an organ donor just by logging in with email or a Facebook or Google account — much easier.
In practice, legal registration may be overemphasized. It may be just as important to simply make your wishes known to your loved ones. When people tell relatives, “If something happens to me, I want to be an organ donor,” families almost always respect their wishes. This is particularly important for minors, who cannot legally register as donors.
Using that insight, Organize is making it easier to conduct social media campaigns to both prompt and collect sentiments about organ donation from Facebook, Twitter and Instagram.
If you post or tweet about organ donation, or include a hashtag like #iwanttobeanorgandonor, #organdonor, #donatemyparts, or any of a number of other relevant terms, Organize captures the information and logs it in a registry. In a year, it has gathered the names of nearly 600,000 people who declare support for organ donation. Now the big question is: Will it actually increase organ donation rates?
We should begin getting an idea pretty soon. Organize has been working with the Nevada Donor Network to test its registry. And in the coming months, several other states will begin using it….(More)”
Public Agenda: “From 2014 to 2015, more than 70,000 residents across the United States and Canada directly decided how their cities and districts should spend nearly $50 million in public funds through a process known as participatory budgeting (PB). PB is among the fastest growing forms of public engagement in local governance, having expanded to 46 communities in the U.S. and Canada in just 6 years.
PB is a young practice in the U.S. and Canada. Until now, there’s been no way for people to get a general understanding of how communities across the U.S. implement PB, who participates, and what sorts of projects get funded. Our report, “Public Spending, By the People” offers the first-ever comprehensive analysis of PB in the U.S. and Canada.
Here’s a summary of what we found:
Overall, communities using PB have invested substantially in the process and have seen diverse participation. But cities and districts vary widely in how they implemented their processes, who participated and what projects voters decided to fund. Officials vary in how much money they allocate to PB and some communities lag far behind in their representation of lower-income and less educated residents.
The data in this report came from 46 different PB processes across the U.S. and Canada. The report is a collaboration with local PB evaluators and practitioners. The work was funded by the Democracy Fund and the Rita Allen Foundation, and completed through a research partnership with the Kettering Foundation.
You can read the findings in brief below, download a PDF of the executive summary, download the full report or scroll through charts and graphics from the report. This report is also part of an ongoing Public Agenda project on participatory budgeting – you can read about the project here.”
Chapter by Bettina Lange and Fiona Haines in the book Regulatory Transformations: “Regulation is no longer the prerogative of either states or markets. Increasingly citizens in association with businesses catalyse regulation which marks the rise of a social sphere in regulation. Around the world, in San Francisco, Melbourne, Munich and Mexico City, citizens have sought to transform how and to what end economic transactions are conducted. For instance, ‘carrot mob’ initiatives use positive economic incentives, not provided by a state legal system, but by a collective of civil society actors in order to change business behaviour. In contrast to ‘negative’ consumer boycotts, ‘carrotmob’ events use ‘buycotts’. They harness competition between businesses as the lever for changing how and for what purpose business transactions are conducted. Through new social media ‘carrotmobs’ mobilize groups of citizens to purchase goods at a particular time in a specific shop. The business that promises to spend the greatest percentage of its takings on, for instance, environmental improvements, such as switching to a supplier of renewable energy, will be selected for an organized shopping spree and financially benefit from the extra income it receives from the ‘carrot mob’ event.’Carrot mob’ campaigns chime with other fundamental challenges to conventional economic activity, such as the shared use of consumer goods through citizens collective consumption which questions traditional conceptions of private property….(More; Other Chapters)”
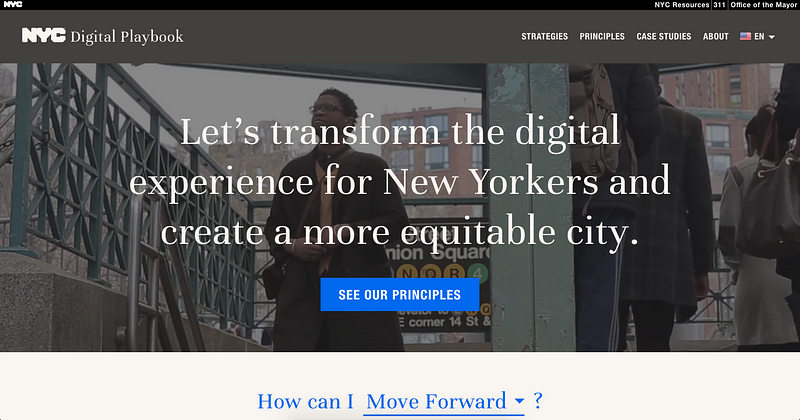
New York City Mayor Bill de Blasio: “…The New York City Digital Playbook outlines how we want residents to experience City services and how we will use digital tools to strengthen communities, online and off. The guidance within the Playbook will challenge all of our agencies and service providers to rethink the way they reach New Yorkers.
Our goal is to make our services more accessible, make our operations more transparent, and make it easy and fun to participate in government. In short — we aim to make New York the most user-friendly and innovative city in the world.
We believe that City government should be at New Yorkers’ fingertips and services should be just a swipe or a click away — just like so much of the technology in the rest of our lives. We also know that there are many people in New York City’s incomparable tech and design community who share this goal and want to lend expertise. So, another important goal of the Playbook is to make it easier for civically minded technologists to help us.
How to use the Playbook
This is an internal vision and strategy document that we will immediately begin to implement across government.
You may ask: if it’s an internal document, why share it publicly? A few reasons:
1. Transparency is a central tenet of our work;
2. This is a work in progress that we want to develop and update in the open.
3. We want to know how you think we can make it better.
The Playbook lives on nyc.gov/playbook.
Also, we’re giving a printed “strategy deck,” or set of cards, to staff across the city. Each card has a different principle or strategy printed on the front and key explanations and tips on the back. City leaders will use these cards to plan together and inspire each other when they’re designing new services, or thinking about how to make existing services better….(More)”
Jeffrey Pomerantz and Robin Peek at First Monday: “Open source. Open access. Open society. Open knowledge. Open government. Even open food. Until quite recently, the word “open” had a fairly constant meaning. The over-use of the word “open” has led to its meaning becoming increasingly ambiguous. This presents a critical problem for this important word, as ambiguity leads to misinterpretation.
“Open” has been applied to a wide variety of words to create new terms, some of which make sense, and some not so much. When we started writing this essay, we thought our working title was simply amusing. But the working title became the actual title, as we found that there are at least 50 different terms in which the word “open” is used, encompassing nearly as many different criteria for openness. In this essay we will attempt to make sense of this open season on the word “open.”
Opening the door on open
The word “open” is, perhaps unsurprisingly, a very old one in the English language, harking back to Early Old English. Unlike some words in English, the definition of “open” has changed very little in the intervening thousand-plus years: the earliest recorded uses of the word are completely consistent with its modern usage as an adjective, indicating a passage through or an access into something (Oxford English Dictionary, 2016).
This meaning leads to the development in the fifteenth century of the phrases “open house,” meaning an establishment in which all are welcome, and “open air,” meaning unenclosed outdoor spaces. One such unenclosed outdoor space that figured large in the fifteenth century, and continues to do so today, is the Commons (Hardin, 1968): land or other resources that are not privately owned, but are available for use to all members of a community. The word “open” in these phrases indicates that all have access to a shared resource. All are welcome to visit an open house, but not to move in; all are welcome to walk in the open air or graze their sheep on the Commons, but not to fence the Commons as part of their backyard. (And the moment at which Commons land ceases to be open is precisely the moment it is fenced by an owner, which is in fact what happened in Great Britain during the Enclosure movement of the sixteenth through eighteenth centuries.)
Running against the grain of this cultural movement to enclosure, the nineteenth century saw the circulating library become the norm — rather than libraries in which massive tomes were literally chained to desks. The interpretation of the word “open” to mean a shared resource to which all had access, fit neatly into the philosophy of the modern library movement of the nineteenth century. The phrases “open shelves” and “open stacks” emerged at this time, referring to resources that were directly available to library users, without necessarily requiring intervention by a librarian. Naturally, however, not all library resources were made openly available, nor are they even today. Furthermore, resources are made openly available with the understanding that, like Commons land, they must be shared: library resources have a due date.
The twentieth century saw an increase in the use of the word “open,” as well as a hint of the confusion that was to come about the interpretation of the word. The term “open society” was coined prior to World War I, to indicate a society tolerant of religious diversity. The “open skies” policy enables a nation to allow other nations’ commercial aviation to fly through its airspace — though, importantly, without giving up control of its airspace. The Open University was founded in the United Kingdom in 1969, to provide a university education to all, with no formal entry requirements. The meaning of the word “open” is quite different across these three terms — or perhaps it would be more accurate to say that these terms use different shadings of the word.
But it has been the twenty-first century that has seen the most dramatic increase in the number of terms that use “open.” The story of this explosion in the use of the word “open” begins, however, with a different word entirely: the word “free.”….
Introduction
Opening the door on open
Speech, beer, and puppies
Open means rights
Open means access
Open means use
Open means transparent
Open means participatory
Open means enabling openness
Open means philosophically aligned with open principles
Openwashing and its discontents
Conclusion“
Claudia Padovani and Elena Pavan in the journal “Global Networks“: In this article, we address transformations in global governance brought about by information and communication technologies (ICTs). Focusing on the specific domain of ‘gender-oriented communication governance’, we investigate online interactions among different kinds of actors active in promoting gender equity in and through the media. By tracing and analysing online issue networks, we investigate which actors are capable of influencing the framing of issues and of structuring discursive practices. From the analysis, different forms of power emerge, reflecting diverse modes of engaging in online interactions, where actors can operate as network ‘programmers’, ‘mobilizers’, or ‘switchers’. Our case study suggests that, often, old ways of conceiving actors’ interactions accompany the implementation of new communication tools, while the availability of a pervasive networked infrastructure does not automatically translate into meaningful interactions among all relevant actors in a specific domain….(More)”
Book review by Trenton G Smith of Behavioral Economics and Public Health : “Modern medicine has long doled out helpful advice to ailing patients about not only drug treatments, but also diet, exercise, alcohol abuse, and many other lifestyle decisions. And for just as long, patients have been failing to follow doctors’ orders. Many of today’s most pressing public health problems would disappear if people would just make better choices.
Enter behavioural economics. A fairly recent offshoot of the dismal science, behavioural economics aims to take the coldly rational decision makers who normally populate economic theories, and instil in them a host of human foibles. Neoclassical (ie, conventional) economics, after all is the study of optimising behaviour in the presence of material constraints—why not add constraints on cognitive capacity, or self-control, or susceptibility to the formation of bad habits? The hope is that by incorporating insights from other behavioural sciences (most notably cognitive psychology and neuroscience) while retaining the methodological rigour of neoclassical economics, behavioural economics will yield a more richly descriptive theory of human behaviour, and generate new and important insights to better inform public policy.
Policy makers have taken notice. In an era in which free-market rhetoric dominates the political landscape, the idea that small changes to public health policies might serve to nudge consumers towards healthier behaviours holds great appeal. Even though some (irrational) consumers might be better off, the argument goes, if certain unhealthy food products were banned (or worse, taxed), this approach would infringe on the rights of the many consumers who want to indulge occasionally, and fully understand the consequences. If governments could instead use evidence from consumer science to make food labels more effective, or to improve the way that healthy foods are presented in school cafeterias, more politically unpalatable interventions in the marketplace might not be needed. This idea, dubbed “libertarian paternalism” by Richard Thaler and Cass Sunstein, has been pursued with gusto in both the UK (David Cameron’s Government formed the Behavioural Insights Team—unofficially described as the Nudge Unit) and the USA (where Sunstein spent time in the Obama administration’s Office of Information and Regulatory Affairs).
Whatever public health practitioners might think about these developments—or indeed, of economics as a discipline—this turn of events has rather suddenly given scholars at the cutting edge of consumer science an influential voice in the regulatory process, and some of the best and brightest have stepped up to contribute. Behavioral Economics & Public Health (edited by Christina Roberto and Ichiro Kawachi) is the product of a 2014 Harvard University exploratory workshop on applying social science insights to public health. As might be expected in a volume that aims to bring together two such inherently multidisciplinary fields, the book’s 11 chapters offer an eclectic mix of perspectives. The editors begin with an excellent overview of the field of behavioural economics and its applications to public health, and an economic perspective can also be found in four of the other chapters: Justin White and William Dow write about intertemporal choice, Kristina Lewis and Jason Block review the use of incentives to promote health, Michael Sanders and Michael Hallsworth describe their experience working within the UK’s Behavioural Insights Team, and Frederick Zimmerman concludes with a thoughtful critique of the field of behavioural economics. The other contributions are largely from the perspectives of psychology and marketing: Dennis Runger and Wendy Wood discuss habit formation, Rebecca Ferrer and colleagues emphasise the importance of emotion in decision making, Brent McFerran discusses social norms in the context of obesity, Jason Riis and Rebecca Ratner explain why some public health communication strategies are more effective than others, and Zoe Chance and colleagues and Brian Wansink offer frameworks for designing environments (eg, in schools and workplaces) that are conducive to healthy choices.
This collection of essays holds many hidden gems, but the one that surprised me the most was the attention given (by Runger and Wood briefly, and Zimmerman extensively) to a dirty little secret that behavioural economists rarely mention: once it is acknowledged that sometimes-irrational consumers can be manipulated into making healthy choices, it does not require much of a leap to conclude that business interests can—and do—use the same methods to push back in the other direction. This conclusion leads Zimmerman to a discussion of power in the marketplace and in our collective political economy, and to a call to action on these larger structural issues in society that neoclassical theory has long neglected….(More; Book)
Book edited by Deborah Avant and Oliver Westerwinter: “Traditional analyses of global security cannot explain the degree to which there is “governance” of important security issues — from combatting piracy to curtailing nuclear proliferation to reducing the contributions of extractive industries to violence and conflict. They are even less able to explain why contemporary governance schemes involve the various actors and take the many forms they do.
Juxtaposing the insights of scholars writing about new modes of governance with the logic of network theory, The New Power Politics offers a framework for understanding contemporary security governance and its variation. The framework rests on a fresh view of power and how it works in global politics. Though power is integral to governance, it is something that emerges from, and depends on, relationships. Thus, power is dynamic; it is something that governors must continually cultivate with a wide range of consequential global players, and how a governor uses power in one situation can have consequences for her future relationships, and thus, future power.
Understanding this new power politics is crucial for explaining and shaping the future of global security politics. This stellar group of scholars analyzes both the networking strategies of would-be governors and their impacts on the effectiveness of governance and whether it reflects broad or narrow concerns on a wide range of contemporary governance issues….(More)”
“This ICIJ database contains information on almost 320,000 offshore entities that are part of the Panama Papers and the Offshore Leaks investigations. The data covers nearly 40 years up to the end of 2015 and links to people and companies in more than 200 countries and territories.
DISCLAIMER
There are legitimate uses for offshore companies and trusts. We do not intend to suggest or imply that any persons, companies or other entities included in the ICIJ Offshore Leaks Database have broken the law or otherwise acted improperly. Many people and entities have the same or similar names. We suggest you confirm the identities of any individuals or entities located in the database based on addresses or other identifiable information. If you find an error in the database please get in touch with us….(More)”