The tiny digital camera on every smartphone has had real impact on African lives


Calestous Juma at Quartz: “…The first major impact of the technology on African users was to expand global connectivity by making it possible for the youth to access information that was collected using the technology via the Internet.

African engineers have been able use such information to design their own technologies suited to local condition. In 2016 Arthur Zhang, a young Cameroonian medical engineering was awarded the $37,000 Africa Prize for Engineering Innovation by the UK Royal Academy of Engineering. Zhang invented the Cardiopad, a tablet computer takes heart readings and sends them to a heart specialist using the Internet.

Zhang was trained in electronic engineering but gained much of the relevant medical knowledge by watching video online, many which had been posted using digital camera. Many more young Africans are following in Zhang footprints in using such material to acquire knowledge that is available through their regular university courses….

In agriculture, farmers can how take diseased images of the leaves of their crops and share them with scientists around the world for identification and advice. Such digital imaging research is an important addition to other agricultural used of mobile phones that constitute low-cost agricultural extension approaches.

Young African engineers are making extensive use of mobile phones for disease diagnosis. Ugandan researchers developed a jacket that diagnoses pneumonia faster than the standard methods used by doctors. Imaging technologies offer additional ways to expand the range of diagnosis for a wide range of diseases.

In low-cost eye are, for example, EyeNetra uses smartphones as a platform to capture the refractive power of the lenses in eyeglasses. EyeNetra is planning to deploy its technology in Nigeria. It has distributed units to be piloted in Gabon, Gambia, Kenya, Morocco, Rwanda, South Africa and Zimbabwe.

There have been concerns that the emerging era of personalized medicine will create a “health divide” between the industrialized and emerging worlds. This is mainly because of human genetic diversity influences the choice of treatment options. Smartphones are becoming as a low-cost way to pre-empt the emergence such a divide.

Climate change is going to force African scientists to study afresh alternations in the microscopic world. With as little as $15 Micro Phone Lens it will soon be possible to turn a regular smartphone into a microscope that capture images and videos at a magnification range of 15-60 times using the phone’s digital zoom feature. The add-on will inspire a new generation of explorers and scientists….(More)”

The Emergence of a Post-Fact World


Francis Fukuyama in Project Syndicate: “One of the more striking developments of 2016 and its highly unusual politics was the emergence of a “post-fact” world, in which virtually all authoritative information sources were called into question and challenged by contrary facts of dubious quality and provenance.

The emergence of the Internet and the World Wide Web in the 1990s was greeted as a moment of liberation and a boon for democracy worldwide. Information constitutes a form of power, and to the extent that information was becoming cheaper and more accessible, democratic publics would be able to participate in domains from which they had been hitherto excluded.

The development of social media in the early 2000s appeared to accelerate this trend, permitting the mass mobilization that fueled various democratic “color revolutions” around the world, from Ukraine to Burma (Myanmar) to Egypt. In a world of peer-to-peer communication, the old gatekeepers of information, largely seen to be oppressive authoritarian states, could now be bypassed.

While there was some truth to this positive narrative, another, darker one was also taking shape. Those old authoritarian forces were responding in dialectical fashion, learning to control the Internet, as in China, with its tens of thousands of censors, or, as in Russia, by recruiting legions of trolls and unleashing bots to flood social media with bad information. These trends all came together in a hugely visible way during 2016, in ways that bridged foreign and domestic politics….

The traditional remedy for bad information, according to freedom-of-information advocates, is simply to put out good information, which in a marketplace of ideas will rise to the top. This solution, unfortunately, works much less well in a social-media world of trolls and bots. There are estimates that as many as a third to a quarter of Twitter users fall into this category. The Internet was supposed to liberate us from gatekeepers; and, indeed, information now comes at us from all possible sources, all with equal credibility. There is no reason to think that good information will win out over bad information….

The inability to agree on the most basic facts is the direct product of an across-the-board assault on democratic institutions – in the US, in Britain, and around the world. And this is where the democracies are headed for trouble. In the US, there has in fact been real institutional decay, whereby powerful interest groups have been able to protect themselves through a system of unlimited campaign finance. The primary locus of this decay is Congress, and the bad behavior is for the most part as legal as it is widespread. So ordinary people are right to be upset.

And yet, the US election campaign has shifted the ground to a general belief that everything has been rigged or politicized, and that outright bribery is rampant. If the election authorities certify that your favored candidate is not the victor, or if the other candidate seemed to perform better in a debate, it must be the result of an elaborate conspiracy by the other side to corrupt the outcome. The belief in the corruptibility of all institutions leads to a dead end of universal distrust. American democracy, all democracy, will not survive a lack of belief in the possibility of impartial institutions; instead, partisan political combat will come to pervade every aspect of life….(More)”

A Guide to Data Innovation for Development – From idea to proof-of-concept


Press Release: “UNDP and UN Global Pulse today released a comprehensive guide on how to integrate new sources of data into development and humanitarian work.

New and emerging data sources such as mobile phone data, social media, remote sensors and satellites have the potential to improve the work of governments and development organizations across the globe.

Entitled A Guide to Data Innovation for Development – From idea to proof-of-concept,’ this publication was developed by practitioners for practitioners. It provides step-by-step guidance for working with new sources of data to staff of UN agencies and international Non-Governmental Organizations.

The guide is a result of a collaboration of UNDP and UN Global Pulse with support from UN Volunteers. Led by UNDP innovation teams in Europe and Central Asia and Arab States, six UNDP offices in Armenia, Egypt, Kosovo[1], fYR Macedonia, Sudan and Tunisia each completed data innovation projects applicable to development challenges on the ground.

The publication builds on these successful case trials and on the expertise of data innovators from UNDP and UN Global Pulse who managed the design and development of those projects.

It provides practical guidance for jump-starting a data innovation project, from the design phase through the creation of a proof-of-concept.

The guide is structured into three sections – (I) Explore the Problem & System, (II) Assemble the Team and (III) Create the Workplan. Each of the sections comprises of a series of tools for completing the steps needed to initiate and design a data innovation project, to engage the right partners and to make sure that adequate privacy and protection mechanisms are applied.

…Download ‘A Guide to Data Innovation for Development – From idea to proof-of-concept’ here.”

Evaluating World Bank Support to Budget Analysis and Transparency


Report by Linnea Mills and Clay G. Wescott: “BOOST is a new resource launched in 2010 to facilitate improved quality, classification, and access to budget data and promote effective use for improved government decision making, transparency and accountability. Using the Government’s own data from public expenditure accounts held in the Government’s Financial Management Information System, and benefiting from a consistent methodology, the BOOST data platform makes highly granular fiscal data accessible and ready-for-use. National authorities can significantly enhance fiscal transparency by publishing summary data and analysis or by providing open access to the underlying dataset. This paper addresses four research questions: Did BOOST help improve the quality of expenditure analysis available to government decision makers? Did it help to develop capacity in central finance and selected spending agencies to sustain expenditure analysis? Did it help to improve public access to expenditure analysis anddata? Did it help to increase awareness of the opportunities for BOOST and expenditure analysis in Sub-Saharan Africa as well as countries outside this region where BOOST has been used (Georgia, Haiti and Tunisia).

Evidence has been drawn from various sources. Survey questionnaires were sent to all World Bank task team leaders for Gates Trust Fund supported countries. Completed questionnaires were received from 18 predominantly African countries (Annex 4). These 18 countries constitute the majority but not all of the countries implementing BOOST with financial support from the Trust Fund. Information has also been gathered through a BOOST stakeholder questionnaire targeting government officials, civil society representatives and representatives from parliaments at country level, field visits to Kenya, Mozambique and Uganda, interviews with stakeholders at the Bank and at country level, participation at regional conferences on BOOST in South Africa and Senegal, and document review. Interviews covered participants from some countries that did not complete questionnaires, such as Haiti.

The research will help to inform the Bill and Melinda Gates Foundation, and the World Bank, the administrator of the trust fund on the achievements of the program, and the value of continuing support. It will inform client country Governments, and non-Government actors interested in improved dissemination and analysis of quality public financial data. The research should also be useful for vendors of similar products like OpenGov; and to international scholars and experts working to better understand public expenditure management in developing countries….(More)”

Through the looking glass: Harnessing big data to respond to violent extremism


Michele Piercey, Carolyn Forbes, and Hasan Davulcu at Devex:”People think and say all sorts of things that they would never actually do. One of the biggest challenges in countering violent extremism is not only figuring out which people hold radical views, but who is most likely to join and act on behalf of violent extremist organizations. Determining who is likely to become violent is key to designing and evaluating more targeted interventions, but it has proven to be extremely difficult.

There are few recognized tools for assessing perceptions and beliefs, such as whether community sentiment about violent extremist organizations is more or less favorable, or which narratives and counternarratives resonate with vulnerable populations.

Program designers and monitoring and evaluation staff often rely on perception surveying to assess attitudinal changes that CVE programs try to achieve, but there are limitations to this method. Security and logistical challenges to collecting perception data in a conflict-affected community can make it difficult to get a representative sample, while ensuring the safety of enumerators and respondents. And given the sensitivity of the subject matter, respondents may be reluctant to express their actual beliefs to an outsider (that is, social desirability bias can affect data reliability).

The rise of smartphone technology and social media uptake among the burgeoning youth populations of many conflict-affected countries presents a new opportunity to understand what people believe from a safer distance, lessening the associated risks and data defects. Seeing an opportunity in the growing mass of online public data, the marketing industry has pioneered tools to “scrape” and aggregate the data to help companies paint a clearer picture of consumer behavior and perceptions of brands and products.

These developments present a critical question for CVE programs: Could similar tools be developed that would analyze online public data to identify who is being influenced by which extremist narratives and influences, learn which messages go viral, and distinguish groups and individuals who simply hold radical views from those who support or carry out violence?

Using data to track radicalization

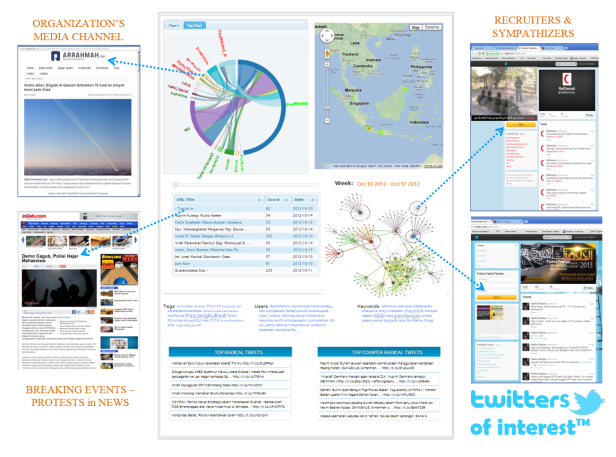
Seeking to answer this question, researchers at Arizona State University’s Center for the Study of Religion and Conflict, Cornell University’s Social Dynamics Laboratory, and Carnegie Mellon’s Center for Computational Analysis of Social and Organizational systems have been innovating a wide variety of data analytics tools. ASU’s LookingGlass tool, for example, maps networks of perception, belief, and influence online. ASU and Chemonics International are now piloting the tool on a CVE program in Libya.

Drawn from the humanities and social and computational sciences, LookingGlass retrieves, categorizes, and analyzes vast amounts of data from across the internet to map the spread of extremist and counter-extremist influence online. The tool displays what people think about their political situation, governments and extremist groups, and tracks changes in these perceptions over time and in response to events. It also lets users visualize how groups emerge, interact, coalesce, and fragment in relation to emerging issues and events and evaluates “information cascades” to assess what causes extremist messages to go viral on social media and what causes them to die out.

By assessing the relative influence and expressed beliefs of diverse groups over time and in critical locations, LookingGlass represents an advanced capability for providing real-time contextual information about the ideological drivers of violent and counter-violent extremist movements online. Click here to view a larger version.

For CVE planners, LookingGlass can map social movements in relation to specific countries and regions. Indonesia, for example, has been the site of numerous violent movements and events. A relatively young democracy, the country’s complex political environment encompasses numerous groups seeking radical change across a wide spectrum of social and political issues….(More)”


Due Diligence? We need an app for that


Ken Banks at kiwanja.net: “The ubiquity of mobile phones, the reach of the Internet, the shear number of problems facing the planet, competitions and challenges galore, pots of money and strong media interest in tech-for-good projects has today created the perfect storm. Not a day goes by without the release of an app hoping to solve something, and the fact so many people are building so many apps to fix so many problems can only be a good thing. Right?

The only problem is this. It’s become impossible to tell good from bad, even real from fake. It’s something of a Wild West out there. So it was no surprise to see this happening recently. Quoting The Guardian:

An app which purported to offer aid to refugees lost in the Mediterranean has been pulled from Apple’s App Store after it was revealed as a fake. The I Sea app, which also won a Bronze medal at the Cannes Lions conference on Monday night, presented itself as a tool to help report refugees lost at sea, using real-time satellite footage to identify boats in trouble and highlighting their location to the Malta-based Migrant Offshore Aid Station (Moas), which would provide help.

In fact, the app did nothing of the sort. Rather than presenting real-time satellite footage – a difficult and expensive task – it instead simply shows a portion of a static, unchanging image. And while it claims to show the weather in the southern Mediterranean, that too isn’t that accurate: it’s for Western Libya.

The worry isn’t only that someone would decide to build a fake app which ‘tackles’ such an emotive subject, but the fact that this particular app won an award and received favourable press. Wired, Mashable, the Evening Standard and Reuters all spoke positively about it. Did no-one check that it did what it said it did?

This whole episode reminds me of something Joel Selanikio wrote in his contributing chapter to two books I’ve recently edited and published. In his chapters, which touch on his work on the Magpi data collection tool in addition to some of the challenges facing the tech-for-development community, Joel wrote:

In going over our user activity logs for the online Magpi app, I quickly realised that no-one from any of our funding organisations was listed. Apparently no-one who was paying us had ever seen our working software! This didn’t seem to make sense. Who would pay for software without ever looking at it? And if our funders hadn’t seen the software, what information were they using when they decided whether to fund us each year?

…The shear number of apps available that claim to solve all manner of problems may seem encouraging on the surface – 1,500 (and counting) to help refugees might be a case in point – but how many are useful? How many are being used? How many solve a problem? And how many are real?

Due diligence? Maybe it’s time we had an app for that…(More)”

Directory of crowdsourcing websites


Directory by Donelle McKinley: “…Here is just a selection of websites for crowdsourcing cultural heritage. Websites are actively crowdsourcing unless indicated with an asterisk…The directory is organized by the type of crowdsourcing process involved, using the typology for crowdsourcing in the humanities developed by Dunn & Hedges (2012). In their study they explain that, “a process is a sequence of tasks, through which an output is produced by operating on an asset”. For example, the Your Paintings Tagger website is for the process of tagging, which is an editorial task. The assets being tagged are images, and the output of the project is metadata, which makes the images easier to discover, retrieve and curate.

Transcription

Alexander Research Library, Wanganui Library * (NZ) Transcription of index cards from 1840 to 2002.

Ancient Lives*, University of Oxford (UK) Transcription of papyri from Greco-Roman Egypt.

AnnoTate, Tate Britain (UK) Transcription of artists’ diaries, letters and sketchbooks.

Decoding the Civil War, The Huntington Library, Abraham Lincoln Presidential Library and Museum &  North Carolina State University (USA). Transcription and decoding of Civil War telegrams from the Thomas T. Eckert Papers.

DIY History, University of Iowa Libraries (USA) Transcription of historical documents.

Emigrant City, New York Public Library (USA) Transcription of handwritten mortgage and bond ledgers from the Emigrant Savings Bank records.

Field Notes of Laurence M. Klauber, San Diego Natural History Museum (USA) Transcription of field notes by the celebrated herpetologist.

Notes from Nature Transcription of natural history museum records.

Measuring the ANZACs, Archives New Zealand and Auckland War Memorial Museum (NZ). Transcription of first-hand accounts of NZ soldiers in WW1.

Old Weather (UK) Transcription of Royal Navy ships logs from the early twentieth century.

Scattered Seeds, Heritage Collections, Dunedin Public Libraries (NZ) Transcription of index cards for Dunedin newspapers 1851-1993

Shakespeare’s World, Folger Shakespeare Library (USA) & Oxford University Press (UK). Transcription of handwritten documents by Shakespeare’s contemporaries. Identification of words that have yet to be recorded in the authoritative Oxford English Dictionary.

Smithsonian Digital Volunteers Transcription Center (USA) Transcription of multiple collections.

Transcribe Bentham, University College London (UK) Transcription of historical manuscripts by philosopher and reformer Jeremy Bentham,

What’s on the menu? New York Public Library (USA) Transcription of historical restaurant menus. …

(Full Directory).

How to implement “open innovation” in city government


Victor Mulas at the Worldbank: “City officials are facing increasingly complex challenges. As urbanization rates grow, cities face higher demand for services from a larger and more densely distributed population. On the other hand, rapid changes in the global economy are affecting cities that struggle to adapt to these changes, often resulting in economic depression and population drain.

“Open innovation” is the latest buzz word circulating in forums on how to address the increased volume and complexity of challenges for cities and governments in general.

But, what is open innovation?

Traditionally, public services were designed and implemented by a group of public officials. Open innovation allows us to design these services with multiple actors, including those who stand to benefit from the services, resulting in more targeted and better tailored services, often implemented through partnership with these stakeholders. Open innovation allows cities to be more productive in providing services while addressing increased demand and higher complexity of services to be delivered.

New York, Barcelona, Amsterdam and many other cities have been experimenting with this concept, introducing challenges for entrepreneurs to address common problems or inviting stakeholders to co-create new services.   Open innovation has gone from being a “buzzword” to another tool in the city officials’ toolbox.

However, even cities that embrace open innovation are still struggling to implement it beyond a few specific areas.  This is understandable, as introducing open innovation practically requires a new way of doing things for city governments, which tend to be complex and bureaucratic organizations.

Counting with an engaged mayor is not enough to bring this kind of transformation. Changing the behavior of city officials requires their buy-in, it can’t be done top down

We have been introducing open innovation to cities and governments for the last three years in Chile, Colombia, Egypt and Mozambique. We have addressed specific challenges and iteratively designed and tested a systematic methodology to introduce open innovation in government through both a top-down and a bottom-up approaches. We have tested this methodology in Colombia (Cali, Barranquilla and Manizales) and Chile (metropolitan area of Gran Concepción).   We have identified “internal champions” (i.e., government officials who advocate the new methodology), and external stakeholders organized in an “innovation hub” that provides long-term sustainability and scalability of interventions. We believe that this methodology is easily applicable beyond cities to other government entities at the regional and national levels. …To understand how the methodology practically works, we describe in this report the process and its results in its application in the city area of Gran Concepción, in Chile. For this activity, the urban transport sector was selected and the target of intervention were the regional and municipal government departments in charge or urban transport in the area of Gran Concepción. The activity in Chile resulted in a threefold impact:

  1. It catalyzed the adoption of the bottom-up smart city model following this new methodology throughout Chile; and
  2. It expanded the implementation and mainstreaming of the methodologies developed and tested through this activity in other World Bank projects.

More information about this activity in Chile can be found in the Smart City Gran Concepcion webpage…(More)”

Building Data Responsibility into Humanitarian Action


Stefaan Verhulst at The GovLab: “Next Monday, May 23rd, governments, non-profit organizations and citizen groups will gather in Istanbul at the first World Humanitarian Summit. A range of important issues will be on the agenda, not least of which the refugee crisis confronting the Middle East and Europe. Also on the agenda will be an issue of growing importance and relevance, even if it does not generate front-page headlines: the increasing potential (and use) of data in the humanitarian context.

To explore this topic, a new paper, “Building Data Responsibility into Humanitarian Action,” is being released today, and will be presented tomorrow at the Understanding Risk Forum. This paper is the result of a collaboration between the United Nations Office for the Coordination of Humanitarian Affairs (OCHA), The GovLab (NYU Tandon School of Engineering), the Harvard Humanitarian Initiative, and Leiden UniversityCentre for Innovation. It seeks to identify the potential benefits and risks of using data in the humanitarian context, and begins to outline an initial framework for the responsible use of data in humanitarian settings.

Both anecdotal and more rigorously researched evidence points to the growing use of data to address a variety of humanitarian crises. The paper discusses a number of data risk case studies, including the use of call data to fight Malaria in Africa; satellite imagery to identify security threats on the border between Sudan and South Sudan; and transaction data to increase the efficiency of food delivery in Lebanon. These early examples (along with a few others discussed in the paper) have begun to show the opportunities offered by data and information. More importantly, they also help us better understand the risks, including and especially those posed to privacy and security.

One of the broader goals of the paper is to integrate the specific and the theoretical, in the process building a bridge between the deep, contextual knowledge offered by initiatives like those discussed above and the broader needs of the humanitarian community. To that end, the paper builds on its discussion of case studies to begin establishing a framework for the responsible use of data in humanitarian contexts. It identifies four “Minimum Humanitarian standards for the Responsible use of Data” and four “Characteristics of Humanitarian Organizations that use Data Responsibly.” Together, these eight attributes can serve as a roadmap or blueprint for humanitarian groups seeking to use data. In addition, the paper also provides a four-step practical guide for a data responsibility framework (see also earlier blog)….(More)” Full Paper: Building Data Responsibility into Humanitarian Action

How to Crowdsource the Syrian Cease-Fire


Colum Lynch at Foreign Policy: “Can the wizards of Silicon Valley develop a set of killer apps to monitor the fragile Syria cease-fire without putting foreign boots on the ground in one of the world’s most dangerous countries?

They’re certainly going to try. The “cessation of hostilities” in Syria brokered by the United States and Russia last month has sharply reduced the levels of violence in the war-torn country and sparked a rare burst of optimism that it could lead to a broader cease-fire. But if the two sides lay down their weapons, the international community will face the challenge of monitoring the battlefield to ensure compliance without deploying peacekeepers or foreign troops. The emerging solution: using crowdsourcing, drones, satellite imaging, and other high-tech tools.

The high-level interest in finding a technological solution to the monitoring challenge was on full display last month at a closed-door meeting convened by the White House that brought together U.N. officials, diplomats, digital cartographers, and representatives of Google, DigitalGlobe, and other technology companies. Their assignment was to brainstorm ways of using high-tech tools to keep track of any future cease-fires from Syria to Libya and Yemen.

The off-the-record event came as the United States, the U.N., and other key powers struggle to find ways of enforcing cease-fires from Syria at a time when there is little political will to run the risk of sending foreign forces or monitors to such dangerous places. The United States has turned to high-tech weapons like armed drones as weapons of war; it now wants to use similar systems to help enforce peace.

Take the Syria Conflict Mapping Project, a geomapping program developed by the Atlanta-based Carter Center, a nonprofit founded by former U.S. President Jimmy Carter and his wife, Rosalynn, to resolve conflict and promote human rights. The project has developed an interactive digital map that tracks military formations by government forces, Islamist extremists, and more moderate armed rebels in virtually every disputed Syrian town. It is now updating its technology to monitor cease-fires.

The project began in January 2012 because of a single 25-year-old intern, Christopher McNaboe. McNaboe realized it was possible to track the state of the conflict by compiling disparate strands of publicly available information — including the shelling and aerial bombardment of towns and rebel positions — from YouTube, Twitter, and other social media sites. It has since developed a mapping program using software provided by Palantir Technologies, a Palo Alto-based big data company that does contract work for U.S. intelligence and defense agencies, from the CIA to the FBI….

Walter Dorn, an expert on technology in U.N. peace operations who attended the White House event, said he had promoted what he calls a “coalition of the connected.”

The U.N. or other outside powers could start by tracking social media sites, including Twitter and YouTube, for reports of possible cease-fire violations. That information could then be verified by “seeded crowdsourcing” — that is, reaching out to networks of known advocates on the ground — and technological monitoring through satellite imagery or drones.

Matthew McNabb, the founder of First Mile Geo, a start-up which develops geolocation technology that can be used to gather data in conflict zones, has another idea. McNabb, who also attended the White House event, believes “on-demand” technologies like SurveyMonkey, which provides users a form to create their own surveys, can be applied in conflict zones to collect data on cease-fire violations….(More)