Stefaan Verhulst
About: “The rate of extinction is about a thousand times what it used to be before humans. One species goes extinct every 5 minutes. Over the past 30 years 75% of all insects went extinct. 95% of all large predatory fish that roamed the seas are now gone. It probably comes as no surprise we are living in the 6th mass extinction. The big difference with the previous five is that this one is induced by humans.
Αugmented Nature is a set of robotic tools that help animals adapt to the mass extinction. The tools enhance the capacities of so called Ecosystem Engineer species to reclaim and change their own habitats.
The resilience of an ecosystem is strongly related to its biodiversity. Ecosystem engineers are species that engineer their environment and are highly interconnected within the ecosystem. Think for example of a beaver building a dam and creating wetlands that form the habitat for hundreds of other species. By actively enhancing these types of capabilities in endangered species we aim to provide an answer to the sharp decline in biodiversity.
We propose an active and animal-centered alternative to the current conservation efforts. Our premise is that humans are part of nature. Hence, efforts that try to separate species or revert nature to a certain state in the past (re-wilding, preservation) are not realistic. Nature is a dynamic system and evolution is equally driven by species adapting to change but also by transforming the environment for their purposes.
We worked in close collaboration with scientists to develop the next generation of high-tech biologging tags. These experimental interventions are the first step towards a future where instead of mitigating our impact on nature, we aim for a positive impact. We demonstrate this approach with two example animals: humpback whales and collared peccaries.,,,(More)”.
Press Release: “Today, the Digital Impact Alliance (DIAL) released its second paper in a series focused on the promise of data for development (D4D). The paper, Leveraging Data for Development to Achieve Your Triple Bottom Line: Mobile Network Operators with Advanced Data for Good Capabilities See Stronger Impact to Profits, People and the Planet, will be presented at GSMA’s Mobile 360 Africa in Kigali.
“The mobile industry has already taken a driving seat in helping reach the Sustainable Development Goals by 2030 and this research reinforces the role mobile network operators in lower-income economies can play to leverage their network data for development and build a new data business safely and securely,” said Kate Wilson, CEO of the Digital Impact Alliance. “Mobile network operators (MNOs) hold unique data on customers’ locations and behaviors that can help development efforts. They have been reluctant to share data because there are inherent business risks and to do so has been expensive and time consuming. DIAL’s research illustrates a path forward for MNOs on which data is useful to achieve the SDGs and why acting now is critical to building a long-term data business.”
DIAL worked with Altai Consulting on both primary and secondary research to inform this latest paper. Primary research included one-on-one in-depth interviews with more than 50 executives across the data for development value chain, including government officials, civil society leaders, mobile network operators and other private sector representatives from both developed and emerging markets. These interviews help inform how operators can best tap into the shared value creation opportunities data for development provides.
Key findings from the in-depth interviews include:
- There are several critical barriers that have prevented scaled use of mobile data for social good – including 1) unclear market opportunities, 2) not enough collaboration among MNOs, governments and non-profit stakeholders and 3) regulatory and privacy concerns;
- While it may be an ideal time for MNOs to increase their involvement in D4D efforts given the unique data they have that can inform development, market shifts suggest the window of opportunity to implement large-scale D4D initiatives will likely not remain open for much longer;
- Mobile Network Operators with advanced data for good capabilities will have the most success in establishing sustainable D4D efforts; and as a result, achieving triple bottom line mandates; and
- Mobile Network Operators should focus on providing value-added insights and services rather than raw data and drive pricing and product innovation to meet the sector’s needs.
“Private sector data availability to drive public sector decision-making is a critical enabler for meeting SDG targets,” said Syed Raza, Senior Director of the Data for Development Team at the Digital Impact Alliance. “Our data for development paper series aims to elevate the efforts of our industry colleagues with the information, insights and tools they need to help drive ethical innovation in this space….(More)”.
Article by Mariana Mazzucato: “The internet giants depend on our data. A new relationship between us and them could deliver real value to society….We should ask how the value of these companies has been created, how that value has been measured, and who benefits from it. If we go by national accounts, the contribution of internet platforms to national income (as measured, for example, by GDP) is represented by the advertisement-related services they sell. But does that make sense? It’s not clear that ads really contribute to the national product, let alone to social well-being—which should be the aim of economic activity. Measuring the value of a company like Google or Facebook by the number of ads it sells is consistent with standard neoclassical economics, which interprets any market-based transaction as signaling the production of some kind of output—in other words, no matter what the thing is, as long as a price is received, it must be valuable. But in the case of these internet companies, that’s misleading: if online giants contribute to social well-being, they do it through the services they provide to users, not through the accompanying advertisements.
This way we have of ascribing value to what the internet giants produce is completely confusing, and it’s generating a paradoxical result: their advertising activities are counted as a net contribution to national income, while the more valuable services they provide to users are not.
Let’s not forget that a large part of the technology and necessary data was created by all of us, and should thus belong to all of us. The underlying infrastructure that all these companies rely on was created collectively (via the tax dollars that built the internet), and it also feeds off network effects that are produced collectively. There is indeed no reason why the public’s data should not be owned by a public repository that sells the data to the tech giants, rather than vice versa. But the key issue here is not just sending a portion of the profits from data back to citizens but also allowing them to shape the digital economy in a way that satisfies public needs. Using big data and AI to improve the services provided by the welfare state—from health care to social housing—is just one example.
Only by thinking about digital platforms as collective creations can we construct a new model that offers something of real value, driven by public purpose. We’re never far from a media story that stirs up a debate about the need to regulate tech companies, which creates a sense that there’s a war between their interests and those of national governments. We need to move beyond this narrative. The digital economy must be subject to the needs of all sides; it’s a partnership of equals where regulators should have the confidence to be market shapers and value creators….(More)”.
Economic failures cause us serious problems. We need to build simulations of the economy at a much more fine-grained level that take advantage of all the data that computer technologies and the Internet provide us with. We need new technologies of economic prediction that take advantage of the tools we have in the 21st century.
Places like the US Federal Reserve Bank make predictions using a system that has been developed over the last eighty years or so. This line of effort goes back to the middle of the 20th century, when people realized that we needed to keep track of the economy. They began to gather data and set up a procedure for having firms fill out surveys, for having the census take data, for collecting a lot of data on economic activity and processing that data. This system is called “national accounting,” and it produces numbers like GDP, unemployment, and so on. The numbers arrive at a very slow timescale. Some of the numbers come out once a quarter, some of the numbers come out once a year. The numbers are typically lagged because it takes a lot of time to process the data, and the numbers are often revised as much as a year or two later. That system has been built to work in tandem with the models that have been built, which also process very aggregated, high-level summaries of what the economy is doing. The data is old fashioned and the models are old fashioned.
It’s a 20th-century technology that’s been refined in the 21st century. It’s very useful, and it represents a high level of achievement, but it is now outdated. The Internet and computers have changed things. With the Internet, we can gather rich, detailed data about what the economy is doing at the level of individuals. We don’t have to rely on surveys; we can just grab the data. Furthermore, with modern computer technology we could simulate what 300 million agents are doing, simulate the economy at the level of the individuals. We can simulate what every company is doing and what every bank is doing in the United States. The model we could build could be much, much better than what we have now. This is an achievable goal.
But we’re not doing that, nothing close to that. We could achieve what I just said with a technological system that’s simpler than Google search. But we’re not doing that. We need to do it. We need to start creating a new technology for economic prediction that runs side-by-side with the old one, that makes its predictions in a very different way. This could give us a lot more guidance about where we’re going and help keep the economic shit from hitting the fan as often as it does….(More)”.
Stanford Encyclopedia of Philosophy: “Artificial intelligence (AI) is the field devoted to building artificial animals (or at least artificial creatures that – in suitable contexts – appear to be animals) and, for many, artificial persons (or at least artificial creatures that – in suitable contexts – appear to be persons).[1] Such goals immediately ensure that AI is a discipline of considerable interest to many philosophers, and this has been confirmed (e.g.) by the energetic attempt, on the part of numerous philosophers, to show that these goals are in fact un/attainable. On the constructive side, many of the core formalisms and techniques used in AI come out of, and are indeed still much used and refined in, philosophy: first-order logic and its extensions; intensional logics suitable for the modeling of doxastic attitudes and deontic reasoning; inductive logic, probability theory, and probabilistic reasoning; practical reasoning and planning, and so on. In light of this, some philosophers conduct AI research and development as philosophy.
In the present entry, the history of AI is briefly recounted, proposed definitions of the field are discussed, and an overview of the field is provided. In addition, both philosophical AI (AI pursued as and out of philosophy) and philosophy of AI are discussed, via examples of both. The entry ends with some de rigueur speculative commentary regarding the future of AI….(More)”.
Samo Burja at LessWrong:” …The purpose of a bureaucracy is to save the time of a competent person. Put another way: to save time, some competent people will create a system that is meant to do exactly what they want — nothing more and nothing less. In particular, it’s necessary to create a bureaucracy when you are both (a) trying to do something that you do not have the capacity to do on your own, and (b) unable to find a competent, aligned person to handle the project for you. Bureaucracies ameliorate the problem of talent and alignment scarcity.
Features of Bureaucracies
Bureaucrats are expected to act according to a script, or a set of procedures — and that’s it.
Owners don’t trust that bureaucrats will be competent or aligned enough to act in line with the owner’s wishes of their own accord. Given this lack of trust, owners should be trying to disempower bureaucrats. Bureaucracies are built to align people and make them sufficiently competent by chaining them with rules. When bureaucracies deliberately restrict innovation, they are doing it for good reason.
Bureaucrats are meant to have only borrowed power (power that can easily be taken away) given to them by the owner or operator of the bureaucracy.
Effective Bureaucracies
What is an effective, owned bureaucracy? Why are effective bureaucracies owned? To begin, we must make two important distinctions: one between owned and abandoned bureaucracies, and one between effective and ineffective bureaucracies.
Owned bureaucracies are bureaucracies with an owner; they’re bureaucracies that someone can shape. Abandoned bureaucracies are bureaucracies without an owner.
If a bureaucracy is owned, the bureaucracy’s creator is likely the owner. The creator will have knowledge about the setup of the bureaucracy that is necessary for properly reforming it. Others, unless given this information, will not understand the bureaucracy well enough to properly reform it.
The person technically in charge of the bureaucracy (e.g. the C.E.O. of a company who is not its founder) might not be its owner simply because he or she doesn’t have sufficient information about the bureaucracy’s setup to guide it. As a result, the official head of a given bureaucracy may just be another bureaucrat.
While the owner is typically the creator, this needn’t be true, as long as the new owner has come to understand enough of the function of the bureaucracy to make effective adaptations to its procedures.
Effective bureaucracies are bureaucracies that are handling the project they were created to handle. Ineffective bureaucracies are bureaucracies that are not handling the project they were created to handle.
Bureaucracies that are properly set up will be effective at the start. Changes in reality require changes in procedures, however, so a bureaucracy’s procedures inevitably need to be altered appropriately for it to remain effective. Over time, abandoned bureaucracies, having no person who can functionally shape the bureaucracy to make these changes, quickly become ineffective bureaucracies.
Owned bureaucracies, on the other hand, have a shot at making these adaptations to prevent decay. If the owner is skilled, the bureaucracy’s procedures can be modified, and the bureaucracy will continue serving its original purpose. If the owner is unskilled, it is as if the bureaucracy is abandoned — the owner’s efforts to change the bureaucracy’s strategies won’t yield successful adaptation, and the bureaucracy will become ineffective. As a result, for a bureaucracy to remain effective over time, it must be an owned, not abandoned, bureaucracy with a sufficiently capable owner.
Losing and Dismantling Bureaucracies
Bureaucracies are best thought of as an extension of their creator and as a source of power for him or her. However, the owner can lose control of the bureaucracy over time, as bureaucrats convert borrowed power into owned power by exploiting information asymmetries. While owners will try to limit the owned power of their bureaucrats, the bureaucrats will have more than enough time to study the instruments of their control and will learn what is rewarded and what isn’t….
The origin of bureaucracies lies in them extending power and effects far beyond what a single individual can do. They can do so in the absence of expensive and difficult coordination, or difficult to train and evaluate individual talent.
Much like factories can produce cheap products at scale with unskilled labor, displacing craftsmen, so have bureaucracies displaced local social fabric as the generators of social outcomes.
We find ourselves embedded in a bureaucratized landscape. What can or cannot be done in it, is determined by the organizations composing it. The constant drive by talented individuals to both extend power and make due with unskilled white collar labor (a category that economists should recognize and talk more about) have littered the landscape with many large organizations. Some remain piloted, others are long abandoned. Some continue to perform vital social functions, others lumber about making life difficult.
Much as we might bemoan the very real human cost bureaucracies impose, they currently provide services at economies that are otherwise simply not possible. We must acknowledge our collective and individual dependence on them and plan to interact accordingly….(More)”.
Marshall Allen at ProPublica: “With little public scrutiny, the health insurance industry has joined forces with data brokers to vacuum up personal details about hundreds of millions of Americans, including, odds are, many readers of this story. The companies are tracking your race, education level, TV habits, marital status, net worth. They’re collecting what you post on social media, whether you’re behind on your bills, what you order online. Then they feed this information into complicated computer algorithms that spit out predictions about how much your health care could cost them.
Are you a woman who recently changed your name? You could be newly married and have a pricey pregnancy pending. Or maybe you’re stressed and anxious from a recent divorce. That, too, the computer models predict, may run up your medical bills.
Are you a woman who’s purchased plus-size clothing? You’re considered at risk of depression. Mental health care can be expensive.
Low-income and a minority? That means, the data brokers say, you are more likely to live in a dilapidated and dangerous neighborhood, increasing your health risks.
“We sit on oceans of data,” said Eric McCulley, director of strategic solutions for LexisNexis Risk Solutions, during a conversation at the data firm’s booth. And he isn’t apologetic about using it. “The fact is, our data is in the public domain,” he said. “We didn’t put it out there.”
Insurers contend they use the information to spot health issues in their clients — and flag them so they get services they need. And companies like LexisNexis say the data shouldn’t be used to set prices. But as a research scientist from one company told me: “I can’t say it hasn’t happened.”
At a time when every week brings a new privacy scandal and worries abound about the misuse of personal information, patient advocates and privacy scholars say the insurance industry’s data gathering runs counter to its touted, and federally required, allegiance to patients’ medical privacy. The Health Insurance Portability and Accountability Act, or HIPAA, only protects medical information.
“We have a health privacy machine that’s in crisis,” said Frank Pasquale, a professor at the University of Maryland Carey School of Law who specializes in issues related to machine learning and algorithms. “We have a law that only covers one source of health information. They are rapidly developing another source.”…(More)”.
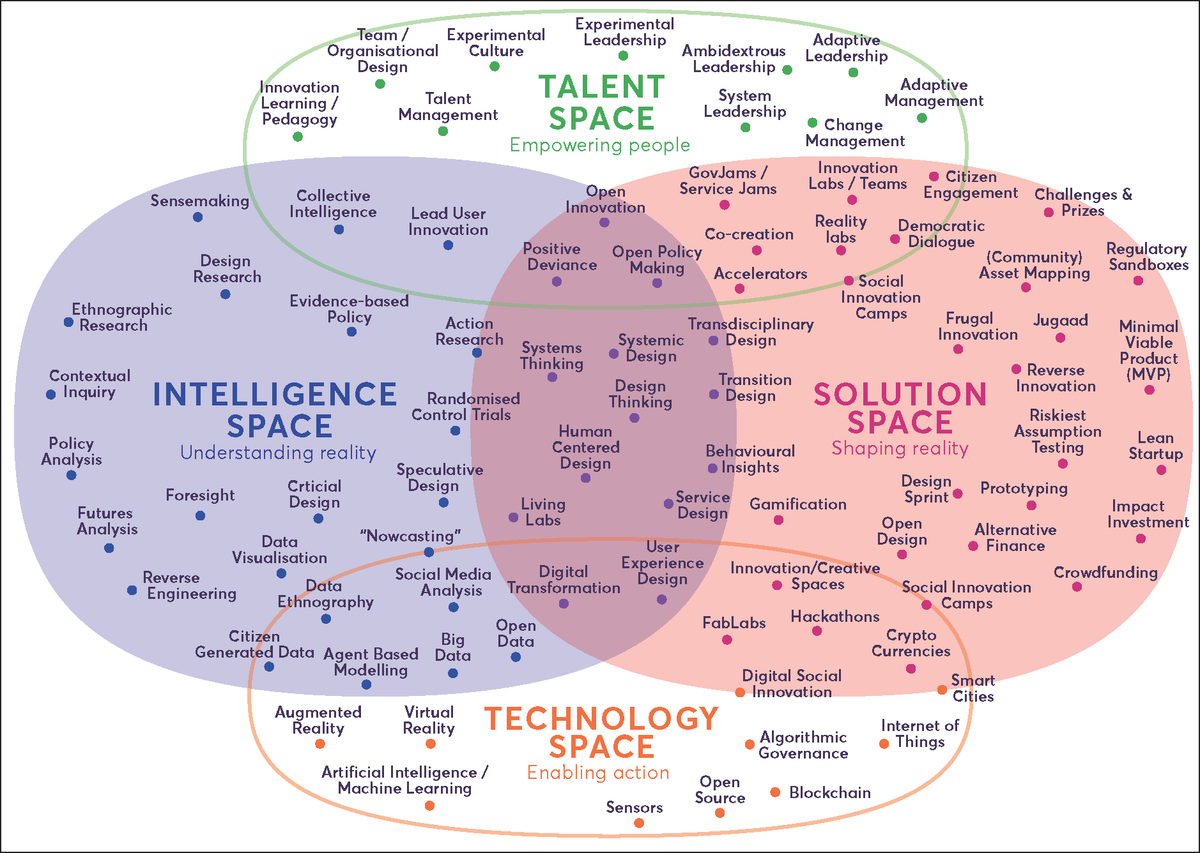
Essay by Marlieke Kieboom:”…The question ‘what is a (social innovation) lab?’ is as old as the lab community itself and seems to return at every (social innovation) lab gathering. It came up at the very first event of its kind (Kennisland’s Lab2: Lab for Labs, Amsterdam 2013) and has been debated at every consequent event ever since under hashtags like #socinnlabs, #sociallabs and #psilabs (see MaRs’s Labs for Systems Change — 2014, Nesta’s Labworks — 2015, EU Policy lab’s Lab Connections — 2016 and ESADE’s Labs for Social Innovation — 2017).
However, the concept has remained roughly the same since we saw the first wave of labs (Helsinki Design Lab, MindLab and Reos’ Change Labs) in the early 2010’s. Social innovation labs are permanent or short term structures/projects/events that use a variety of experimental methods to support collaboration between stakeholders to collectively address social challenges at a systemic level. Stakeholders range from citizens and community action groups to businesses, universities and public administrations. Their specific characteristics (e.g. developing experimental user-led research methods, building innovation capacity building, convening multi-disciplinary teams, working to reach scale) and shapes (public sector innovation labs, social innovations labs, digital service labs, policy labs) are well described in many publications (e.g. Lab Matters, 2014; Labs for Social Innovation, 2017).
As Nesta neatly shows innovation labs are part of a family, or a movement of connected experimental, innovative approaches like service design, behavioural insights, citizen engagement, and so on.
So why does this question keep coming back? The roots of the confusion and debates may lie in the word ‘social’. The medical, technological, and business sectors know exactly what they aim for in their innovation labs. They are ‘controlled-for’ environments where experimentation leads to developing, testing and scaling futuristic (mostly for profit) products, like self-driving cars, cancer medicines, drug test strips and cultured meat. Some of these products contribute to a more just, equal, sustainable world, while others don’t.
For working on societal issues like climate change, immigration patterns or a drug overdose crisis, lab settings are and should be unmistakably more open and porous. Complex, systemic challenges are impossible to capture between four lab walls, nor should we even try as they arguably arose from isolated, closed, and disconnected socio-economic interactions. Value creation for these type of challenges therefore lies outside closed, competitive, measurable spaces: in forging new collaborations, open-sourcing methodologies, encouraging curious mindsets and diversifying social movements. Consequently social lab outcomes are less measurable and concrete, ranging from reframing existing (socio-cultural) paradigms, to designing new procurement procedures and policies, to delivering new (digital and non-digital) public services. Try to ‘randomize-control-trial’ that!…(More).
Paper by Devid Kumar Basyal et al: “The purpose of this paper is to revisit the relationship between E-government and corruption using global panel data from 176 countries covering the period from 2003 to 2014, considering other potential determinants, such as economic prosperity (gross domestic product per capita [GDPPC]), price stability (inflation), good governance (political stability and government effectiveness) and press freedom (civil liberties and political rights) indicators. Hence, the main rationale of this study is to reexamine the conventional wisdom as to the relationship between E-government and corruption using panel data independent of any preexisting notions. …
No statistical evidence was found for the idea that E-government has a positive impact on corruption reduction following a rigorous test of the proposition. However, strong evidence was found for the positive impact of a country’s government effectiveness, political stability and economic status. There also appears to be some evidence for the effect of GDPPC and civil liberties. There is no evidence to prove that inflation and political rights have any corruption reducing the effect…
The findings of the study demonstrate that E-government is less significant for reducing corruption compared to other factors. Hence, policymakers should further focus on other potential areas such as socio-economic factors, good governance, culture and transparency to combat corruption in addition to improving digital government…(More)”.
Olivia Solon at The Guardian: “In August 2016, the Australian government released an “anonymised” data set comprising the medical billing records, including every prescription and surgery, of 2.9 million people.
Names and other identifying features were removed from the records in an effort to protect individuals’ privacy, but a research team from the University of Melbourne soon discovered that it was simple to re-identify people, and learn about their entire medical history without their consent, by comparing the dataset to other publicly available information, such as reports of celebrities having babies or athletes having surgeries.
The government pulled the data from its website, but not before it had been downloaded 1,500 times.
This privacy nightmare is one of many examples of seemingly innocuous, “de-identified” pieces of information being reverse-engineered to expose people’s identities. And it’s only getting worse as people spend more of their lives online, sprinkling digital breadcrumbs that can be traced back to them to violate their privacy in ways they never expected.
Nameless New York taxi logs were compared with paparazzi shots at locations around the city to reveal that Bradley Cooper and Jessica Alba were bad tippers. In 2017 German researchers were able to identify people based on their “anonymous” web browsing patterns. This week University College London researchers showed how they could identify an individual Twitter user based on the metadata associated with their tweets, while the fitness tracking app Polar revealed the homes and in some cases names of soldiers and spies.
“It’s convenient to pretend it’s hard to re-identify people, but it’s easy. The kinds of things we did are the kinds of things that any first-year data science student could do,” said Vanessa Teague, one of the University of Melbourne researchers to reveal the flaws in the open health data.
One of the earliest examples of this type of privacy violation occurred in 1996 when the Massachusetts Group Insurance Commission released “anonymised” data showing the hospital visits of state employees. As with the Australian data, the state removed obvious identifiers like name, address and social security number. Then the governor, William Weld, assured the public that patients’ privacy was protected….(More)”.