Ethical Considerations in Re-Using Private Sector Data for Migration-Related Policy


IOM practitioner’s paper: “This paper assesses the ethical risks of using non-traditional data sources to inform migration related policymaking and suggests practical safeguards for various stages during the data cycle. The past decade has witnessed the rapid growth of non-traditional data (social media, mobile phones, satellite data, bank records, etc.) and their use in migration research and policy. While these data sources may be tempting and shed light on main migration trends, ensuring the ethical and responsible use of big data at every stage of migration research and policymaking is complex.

The recognition of the potential of new data sources for migration policy has grown exponentially in recent years. Data innovation is one of the crosscutting priorities of IOM’s Migration Data Strategy.
Further, the UN General Assembly recognises rapid technological developments and their potential in
achieving the Sustainable Development Goals and the Global Compact for Safe, Orderly and Regular Migration highlights the importance of harnessing data innovation to improve data and evidence for informed policies on migration. However, with big data comes big risks. New technological developments have opened new challenges, particularly, concerning data protection, individual privacy, human security,
and fundamental rights. These risks can be greater for certain migrant and displaced groups.
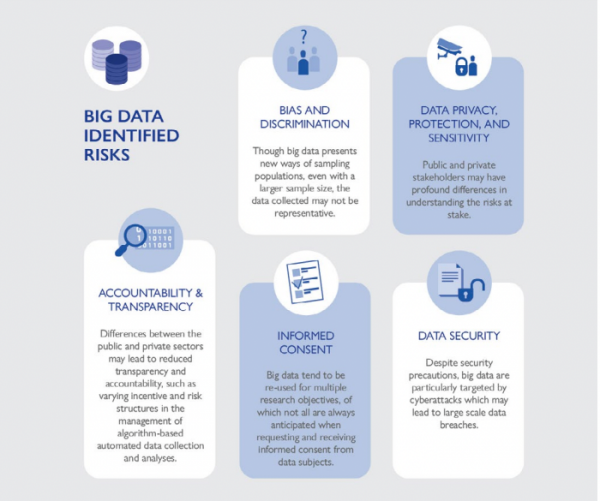
The identified risks are:…(More)” (see also Big Data for Migration Alliance)

Big Data and Official Statistics


Paper by Katharine G. Abraham: “The infrastructure and methods for developed countries’ economic statistics, largely established in the mid-20th century, rest almost entirely on survey and administrative data. The increasing difficulty of obtaining survey responses threatens the sustainability of this model. Meanwhile, users of economic data are demanding ever more timely and granular information. “Big data” originally created for other purposes offer the promise of new approaches to the compilation of economic data. Drawing primarily on the U.S. experience, the paper considers the challenges to incorporating big data into the ongoing production of official economic statistics and provides examples of progress towards that goal to date. Beyond their value for the routine production of a standard set of official statistics, new sources of data create opportunities to respond more nimbly to emerging needs for information. The concluding section of the paper argues that national statistical offices should expand their mission to seize these opportunities…(More)”.

Decisions Over Decimals: Striking the Balance between Intuition and Information


Book by Christopher J. Frank, Paul F. Magnone, Oded Netzer: “Agile decision making is imperative as you lead in a data-driven world. Amid streams of data and countless meetings, we make hasty decisions, slow decisions, and often no decisions. Uniquely bridging theory and practice, Decision over Decimals breaks this pattern by uniting data intelligence with human judgment to get to action – a sharp approach the authors refer to as Quantitative Intuition (QI). QI raises the power of thinking beyond big data without neglecting it and chasing the perfect decision while appreciating that such a thing can never really exist….(More)”.

Smart Streetlights are Casting a Long Shadow Over Our Cities


Article by Zhile Xie: “This is not a surveillance system—nobody is watching it 24 hours a day,” said Erik Caldwell, director of economic development in San Diego, in an interview where he was asked if the wide deployment of “smart” streetlights had turned San Diego into a surveillance city. Innocuous at first glance, this statement demonstrates the pernicious impact of artificial intelligence on new “smart” streetlight systems. As Caldwell suggests, a central human vision is important for the streetlight to function as a surveillance instrument. However, the lack of human supervision only suggests its enhanced capacity. Smart sensors are able to process and communicate environmental information that does not present itself in a visual format and does not rely on human interpretation. On the one hand, they reinforce streetlights’ function as a surveillance instrument, historically associated with light and visibility. On the other hand, in tandem with a wide range of sensors embedded in our everyday environment, they also enable for-profit data extraction on a vast scale,  under the auspices of a partnership between local governments and tech corporations. 

The streetlight was originally designed as a surveillance device and has been refined to that end ever since then. Its association with surveillance and security can be found as early as 400 BC. Citizens of Ancient Rome started to install an oil lamp in front of every villa to prevent tripping or thefts, and an enslaved person would be designated to watch the lamp—lighting was already paired with the notion of control through slavery. As Wolfgang Schivelbusch has detailed in his book Disenchanted Light, street lighting also emerged in medieval European cities alongside practices of policing. Only designated watchmen who carried a torch and a weapon were allowed to be out on the street. This ancient connection between security and visibility has been the basis of the wide deployment of streetlights in modern cities. Moreover, as Edwin Heathcote has explained in a recent article for the Architectural Review, gas streetlights were first introduced to Paris during Baron Haussmann’s restructuring of the city between 1853 and 1870, which was designed in part to prevent revolutionary uprisings. The invention of electric light bulbs in the late nineteenth century in Europe triggered new fears and imaginations around the use of streetlights for social control. For instance, in his 1894 dystopian novel The Land of the Changing Sun, W.N. Harben envisions an electric-optical device that makes possible 24-hour surveillance over the entire population of an isolated country, Alpha. The telescopic system is aided by an artificial “sun” that lights up the atmosphere all year round, along with networked observatories across the land that capture images of their surroundings, which are transmitted to a “throne room” for inspection by the king and police…(More)”.

Landsat turns 50: How satellites revolutionized the way we see – and protect – the natural world


Article by Stacy Morford: “Fifty years ago, U.S. scientists launched a satellite that dramatically changed how we see the world.

It captured images of Earth’s surface in minute detail, showing how wildfires burned landscapes, how farms erased forests, and many other ways humans were changing the face of the planet.

The first satellite in the Landsat series launched on July 23, 1972. Eight others followed, providing the same views so changes could be tracked over time, but with increasingly powerful instruments. Landsat 8 and Landsat 9 are orbiting the planet today, and NASA and the U.S. Geological Survey are planning a new Landsat mission.

The images and data from these satellites are used to track deforestation and changing landscapes around the world, locate urban heat islands, and understand the impact of new river dams, among many other projects. Often, the results help communities respond to risks that may not be obvious from the ground.

Here are three examples of Landsat in action, from The Conversation’s archive.

Tracking changes in the Amazon

When work began on the Belo Monte Dam project in the Brazilian Amazon in 2015, Indigenous tribes living along the Big Bend of the Xingu River started noticing changes in the river’s flow. The water they relied on for food and transportation was disappearing.

Upstream, a new channel would eventually divert as much as 80% of the water to the hydroelectric dam, bypassing the bend.

The consortium that runs the dam argued that there was no scientific proof that the change in water flow harmed fish.

But there is clear proof of the Belo Monte Dam project’s impact – from above, write Pritam DasFaisal HossainHörður Helgason and Shahzaib Khan at the University of Washington. Using satellite data from the Landsat program, the team showed how the dam dramatically altered the hydrology of the river…

It’s hot in the city – and even hotter in some neighborhoods

Landsat’s instruments can also measure surface temperatures, allowing scientists to map heat risk street by street within cities as global temperatures rise.

“Cities are generally hotter than surrounding rural areas, but even within cities, some residential neighborhoods get dangerously warmer than others just a few miles away,” writes Daniel P. Johnson, who uses satellites to study the urban heat island effect at Indiana University.

Neighborhoods with more pavement and buildings and fewer trees can be 10 degrees Fahrenheit (5.5 C) or more warmer than leafier neighborhoods, Johnson writes. He found that the hottest neighborhoods tend to be low-income, have majority Black or Hispanic residents and had been subjected to redlining, the discriminatory practice once used to deny loans in racial and ethnic minority communities…(More)”.

What Might Hannah Arendt Make of Big Data?: On Thinking, Natality, and Narrative with Big Data


Paper by Daniel Brennan: “…considers the phenomenon of Big Data through the work of Hannah Arendt on technology and on thinking. By exploring the nuance to Arendt’s critique of technology, and its relation to the social and political spheres of human activity, the paper presents a case for considering the richness of Arendt’s thought for approaching moral questions of Big Data. The paper argues that the nuances of Arendt’s writing contribute a sceptical, yet also hopeful lens to the moral potential of Big Data. The scepticism is due to the potential of big data to reduce humans to a calculable, and thus manipulatable entity. Such warnings are rife throughout Arendt’s oeuvre. The hope is found in the unique way that Arendt conceives of thinking, as having a conversation with oneself, unencumbered by ideological, or fixed accounts of how things are, in a manner which challenges preconceived notions of the self and world. If thinking can be aided by Big Data, then there is hope for Big Data to contribute to the project of natality that characterises Arendt’s understanding of social progress. Ultimately, the paper contends that Arendt’s definition of what constitutes thinking is the mediator to make sense of the morally ambivalence surrounding Big Data. By focussing on Arendt’s account of the moral value of thinking, the paper provides an evaluative framework for interrogating uses of Big Data…(More)”.

Expert Group to Eurostat releases its report on the re-use of privately-held data for Official Statistics


Blog by Stefaan Verhulst: “…To inform its efforts, Eurostat set up an expert group in 2021 on ‘Facilitating the use of new data sources for official statistics’ to reflect on opportunities offered by the data revolution to enhance the reuse of private sector data for official statistics”.

Data reuse is a particularly important area for exploration, both because of the potential it offers and because it is not sufficiently covered by current policies. Data reuse occurs when data collected for one purpose is shared and reused for another, often with resulting social benefit. Currently, this process is limited by a fragmented or outdated policy and regulatory framework, and often quite legitimate concerns over ethical challenges represented by sharing (e.g., threats to individual privacy).

Nonetheless, despite such hurdles, a wide variety of evidence supports the idea that responsible data reuse can strengthen and supplement official statistics, and potentially lead to lasting and positive social impact.

Having reviewed and deliberated about these issues over several months, the expert group issued its report this week entitled “Empowering society by reusing privately held data for official statistics”. It seeks to develop recommendations and a framework for sustainable data reuse in the production of official statistics. It highlights regulatory gaps, fragmentation of practices, and a lack of clarity regarding businesses’ rights and obligations, and it draws attention to the ways in which current efforts to reuse data have often led to ad-hoc, one-off projects rather than systematic transformation.

The report considers a wide variety of evidence, including historical, policy, and academic research, as well as the theoretical literature… (More)”.

Read the Eurostat report at: https://ec.europa.eu/eurostat/cros/content/read-final-report_en

Unleashing the power of big data to guide precision medicine in China


Article by Yvaine Ye in Nature: “Precision medicine in China was given a boost in 2016 when the government included the field in its 13th five-year economic plan. The policy blueprint, which defined the country’s spending priorities until 2020, pledged to “spur innovation and industrial application” in precision medicine alongside other areas such as smart vehicles and new materials.

Precision medicine is part of the Healthy China 2030 plan, also launched in 2016. The idea is to use the approach to tackle some major health-care challenges the country faces, such as rising cancer rates and issues related to an ageing population. Current projections suggest that, by 2040, 28% of China’s population will be over 60 years old.

Following the announcement of the five-year plan, China’s Ministry of Science and Technology (MOST) launched a precision-medicine project as part of its National Key Research and Development Program. MOST has invested about 1.3 billion yuan (US$200.4 million) in more than 100 projects from 2016 to 2018. These range from finding new drug targets for chronic diseases such as diabetes to developing better sequencing technologies and building a dozen large population cohorts comprising hundreds of thousands of people from across China.

China’s population of 1.4 billion people means the country has great potential for using big data to study health issues, says Zhengming Chen, an epidemiologist and chronic-disease researcher at the University of Oxford, UK. “The advantage is especially prominent in the research of rare diseases, where you might not be able to have a data set in smaller countries like the United Kingdom, where only a handful of cases exist,” says Chen, who leads the China Kadoorie Biobank, a chronic-disease initiative that launched in 2004. It recruited more than 510,000 adults from 10 regions across China in its first 4 years, collecting data through questionnaires and by recording physical measurements and storing participants’ blood samples for future study. So far, the team has investigated whether some disease-related lifestyle factors that have been identified in the West apply to the Chinese population. They have just begun to dig into participants’ genetic data, says Chen.

Another big-data precision-medicine project launched in 2021, after Huijun Yuan, a physician who has been researching hereditary hearing loss for more than two decades, founded the Institute of Rare Diseases at West China Hospital in Chengdu, Sichuan province, in 2020. By 2025, the institute plans to set up a database of 100,000 people from China who have rare conditions, including spinal muscular atrophy and albinism. It will contain basic health information and data relating to biological samples, such as blood for gene sequencing. Rare diseases are hard to diagnose, because their incidences are low. But the development of technologies such as genetic testing and artificial intelligence driven by big data is providing a fresh approach to diagnosing these rare conditions, and could pave the way for therapies…(More)”.

Dynamic World


About: “The real world is as dynamic as the people and natural processes that shape it. Dynamic World is a near realtime 10m resolution global land use land cover dataset, produced using deep learning, freely available and openly licensed. It is the result of a partnership between Google and the World Resources Institute, to produce a dynamic dataset of the physical material on the surface of the Earth. Dynamic World is intended to be used as a data product for users to add custom rules with which to assign final class values, producing derivative land cover maps.

Key innovations of Dynamic World

  1. Near realtime data. Over 5000 Dynamic World image are produced every day, whereas traditional approaches to building land cover data can take months or years to produce. As a result of leveraging a novel deep learning approach, based on Sentinel-2 Top of Atmosphere, Dynamic World offers global land cover updating every 2-5 days depending on location.
  2. Per-pixel probabilities across 9 land cover classes. A major benefit of an AI-powered approach is the model looks at an incoming Sentinel-2 satellite image and, for every pixel in the image, estimates the degree of tree cover, how built up a particular area is, or snow coverage if there’s been a recent snowstorm, for example.
  3. Ten meter resolution. As a result of the European Commission’s Copernicus Programme making European Space Agency Sentinel data freely and openly available, products like Dynamic World are able to offer 10m resolution land cover data. This is important because quantifying data in higher resolution produces more accurate results for what’s really on the surface of the Earth…(More)”.

Impediment of Infodemic on Disaster Policy Efficacy: Insights from Location Big Data


Paper by Xiaobin Shen, Natasha Zhang Foutz, and Beibei Li: “Infodemics impede the efficacy of business and public policies, particularly in disastrous times when high-quality information is in the greatest demand. This research proposes a multi-faceted conceptual framework to characterize an infodemic and then empirically assesses its impact on the core mitigation policy of a latest prominent disaster, the COVID-19 pandemic. Analyzing a half million records of COVID-related news media and social media, as well as .2 billion records of location data, via a multitude of methodologies, including text mining and spatio-temporal analytics, we uncover a number of interesting findings. First, the volume of the COVID information incurs an inverted-U-shaped impact on individuals’ compliance with the lockdown policy. That is, a smaller volume encourages the policy compliance, whereas an overwhelming volume discourages compliance, revealing negative ramifications of excessive information about a disaster. Second, novel information boosts policy compliance, signifying the value of offering original and distinctive, instead of redundant, information to the public during a disaster. Third, misinformation exhibits a U-shaped influence unexplored by the literature, deterring policy compliance until a larger amount surfaces, diminishing informational value, escalating public uncertainty. Overall, these findings demonstrate the power of information technology, such as media analytics and location sensing, in disaster management. They also illuminate the significance of strategic information management during disasters and the imperative need for cohesive efforts across governments, media, technology platforms, and the general public to curb future infodemics…(More)”.