Fearful of fake news blitz, U.S. Census enlists help of tech giants


Nick Brown at Reuters: “The U.S. Census Bureau has asked tech giants Google, Facebook and Twitter to help it fend off “fake news” campaigns it fears could disrupt the upcoming 2020 count, according to Census officials and multiple sources briefed on the matter.

The push, the details of which have not been previously reported, follows warnings from data and cybersecurity experts dating back to 2016 that right-wing groups and foreign actors may borrow the “fake news” playbook from the last presidential election to dissuade immigrants from participating in the decennial count, the officials and sources told Reuters.

The sources, who asked not to be named, said evidence included increasing chatter on platforms like “4chan” by domestic and foreign networks keen to undermine the survey. The census, they said, is a powerful target because it shapes U.S. election districts and the allocation of more than $800 billion a year in federal spending.

Ron Jarmin, the Deputy Director of the Census Bureau, confirmed the bureau was anticipating disinformation campaigns, and was enlisting the help of big tech companies to fend off the threat.

“We expect that (the census) will be a target for those sorts of efforts in 2020,” he said.

Census Bureau officials have held multiple meetings with tech companies since 2017 to discuss ways they could help, including as recently as last week, Jarmin said.

So far, the bureau has gotten initial commitments from Alphabet Inc’s Google, Twitter Inc and Facebook Inc to help quash disinformation campaigns online, according to documents summarizing some of those meetings reviewed by Reuters.

But neither Census nor the companies have said how advanced any of the efforts are….(More)”.

How the NYPD is using machine learning to spot crime patterns


Colin Wood at StateScoop: “Civilian analysts and officers within the New York City Police Department are using a unique computational tool to spot patterns in crime data that is closing cases.

A collection of machine-learning models, which the department calls Patternizr, was first deployed in December 2016, but the department only revealed the system last month when its developers published a research paper in the Informs Journal on Applied Analytics. Drawing on 10 years of historical data about burglary, robbery and grand larceny, the tool is the first of its kind to be used by law enforcement, the developers wrote.

The NYPD hired 100 civilian analysts in 2017 to use Patternizr. It’s also available to all officers through the department’s Domain Awareness System, a citywide network of sensors, databases, devices, software and other technical infrastructure. Researchers told StateScoop the tool has generated leads on several cases that traditionally would have stretched officers’ memories and traditional evidence-gathering abilities.

Connecting similar crimes into patterns is a crucial part of gathering evidence and eventually closing in on an arrest, said Evan Levine, the NYPD’s assistant commissioner of data analytics and one of Patternizr’s developers. Taken independently, each crime in a string of crimes may not yield enough evidence to identify a perpetrator, but the work of finding patterns is slow and each officer only has a limited amount of working knowledge surrounding an incident, he said.

“The goal here is to alleviate all that kind of busywork you might have to do to find hits on a pattern,” said Alex Chohlas-Wood, a Patternizr researcher and deputy director of the Computational Policy Lab at Stanford University.

The knowledge of individual officers is limited in scope by dint of the NYPD’s organizational structure. The department divides New York into 77 precincts, and a person who commits crimes across precincts, which often have arbitrary boundaries, is often more difficult to catch because individual beat officers are typically focused on a single neighborhood.

There’s also a lot of data to sift through. In 2016 alone, about 13,000 burglaries, 15,000 robberies and 44,000 grand larcenies were reported across the five boroughs.

Levine said that last month, police used Patternizr to spot a pattern of three knife-point robberies around a Bronx subway station. It would have taken police much longer to connect those crimes manually, Levine said.

The software works by an analyst feeding it “seed” case, which is then compared against a database of hundreds of thousands of crime records that Patternizr has already processed. The tool generates a “similarity score” and returns a rank-ordered list and a map. Analysts can read a few details of each complaint before examining the seed complaint and similar complaints in a detailed side-by-side view or filtering results….(More)”.

Big Data in the U.S. Consumer Price Index: Experiences & Plans


Paper by Crystal G. Konny, Brendan K. Williams, and David M. Friedman: “The Bureau of Labor Statistics (BLS) has generally relied on its own sample surveys to collect the price and expenditure information necessary to produce the Consumer Price Index (CPI). The burgeoning availability of big data has created a proliferation of information that could lead to methodological improvements and cost savings in the CPI. The BLS has undertaken several pilot projects in an attempt to supplement and/or replace its traditional field collection of price data with alternative sources. In addition to cost reductions, these projects have demonstrated the potential to expand sample size, reduce respondent burden, obtain transaction prices more consistently, and improve price index estimation by incorporating real-time expenditure information—a foundational component of price index theory that has not been practical until now. In CPI, we use the term alternative data to refer to any data not collected through traditional field collection procedures by CPI staff, including third party datasets, corporate data, and data collected through web scraping or retailer API’s. We review how the CPI program is adapting to work with alternative data, followed by discussion of the three main sources of alternative data under consideration by the CPI with a description of research and other steps taken to date for each source. We conclude with some words about future plans… (More)”.

New Data Tools Connect American Workers to Education and Job Opportunities


Department of Commerce: “These are the real stories of the people that recently participated in the Census Bureau initiative called The Opportunity Project—a novel, collaborative effort between government agencies, technology companies, and nongovernment organizations to translate government open data into user-friendly tools that solve real world problems for families, communities, and businesses nationwide.  On March 1, they came together to share their projects at The Opportunity Project’s Demo Day. Projects like theirs help veterans, aspiring technologists, and all Americans connect with the career and educational opportunities, like Bryan and Olivia did.

One barrier for many American students and workers is the lack of clear data to help match them with educational opportunities and jobs.  Students want information on the best courses that lead to high paying and high demand jobs. Job seekers want to find the jobs that best match their skills, or where to find new skills that open up career development opportunities.  Despite the increasing availability of big data and the long-standing, highly regarded federal statistical system, there remain significant data gaps about basic labor market questions.

  • What is the payoff of a bachelor’s degree versus an apprenticeship, 2-year degree, industry certification, or other credential?
  • What are the jobs of the future?  Which jobs of today also will be the jobs of the future? What skills and experience do companies value most?

The Opportunity Project brings government, communities, and companies like IBM, the veteran-led Shift.org, and Nepris together to create tools to answer simple questions related to education, employment, health, transportation, housing, and many other matters that are critical to helping Americans advance in their lives and careers….(More)”.

Nearly Half of Canadian Consumers Willing to Share Significant Personal Data with Banks and Insurers in Exchange for Lower Pricing, Accenture Study Finds


Press Release: “Nearly half of Canadian consumers would be willing to share significant personal information, such as location data and lifestyle information, with their bank and insurer in exchange for lower pricing on products and services, according to a new report from Accenture (NYSE: ACN).

Consumers willing to share personal data in select scenarios. (CNW Group/Accenture)

Accenture’s global Financial Services Consumer Study, based on a survey of 47,000 consumers in 28 countries which included 2,000 Canadians, found that more than half of consumers would share that data for benefits including more-rapid loan approvals, discounts on gym memberships and personalized offers based on current location.

At the same time, however, Canadian consumers believe that privacy is paramount, with nearly three quarters (72 per cent) saying they are very cautious about the privacy of their personal data. In fact, data security breaches were the second-biggest concern for consumers, behind only increasing costs, when asked what would make them leave their bank or insurer.

“Canadian consumers are willing to sharing their personal data in instances where it makes their lives easier but remain cautious of exactly how their information is being used,” said Robert Vokes, managing director of financial services at Accenture in Canada. “With this in mind, banks and insurers need to deliver hyper-relevant and highly convenient experience in order to remain relevant, retain trust and win customer loyalty in a digital economy.”

Consumers globally showed strong support for personalized insurance premiums, with 64 per cent interested in receiving adjusted car insurance premiums based on safe driving and 52 per cent in exchange for life insurance premiums tied to a healthy lifestyle. Four in five consumers (79 per cent) would provide personal data, including income, location and lifestyle habits, to their insurer if they believe it would help reduce the possibility of injury or loss.

In banking, 81 per cent of consumers would be willing to share income, location and lifestyle habit data for rapid loan approval, and 76 per cent would do so to receive personalized offers based on their location, such as discounts from a retailer. Approximately two-fifths (42 per cent) of Canadian consumers specifically, want their bank to provide updates on how much money they have based on spending that month and 46 per cent want savings tips based on their spending habits.  

Appetite for data sharing differs around the world

Appetite for sharing significant personal data with financial firms was highest in China, with 67 per cent of consumers there willing to share more data for personalized services. Half (50 per cent) of consumers in the U.S. said they were willing to share more data for personalized services, and in Europe — where the General Data Protection Regulation took effect in May — consumers were more skeptical. For instance, only 40 per cent of consumers in both the U.K. and Germany said they would be willing to share more data with banks and insurers in return for personalized services…(More)”,

Our data, our society, our health: a vision for inclusive and transparent health data science in the UK and Beyond


Paper by Elizabeth Ford et al in Learning Health Systems: “The last six years have seen sustained investment in health data science in the UK and beyond, which should result in a data science community that is inclusive of all stakeholders, working together to use data to benefit society through the improvement of public health and wellbeing.

However, opportunities made possible through the innovative use of data are still not being fully realised, resulting in research inefficiencies and avoidable health harms. In this paper we identify the most important barriers to achieving higher productivity in health data science. We then draw on previous research, domain expertise, and theory, to outline how to go about overcoming these barriers, applying our core values of inclusivity and transparency.

We believe a step-change can be achieved through meaningful stakeholder involvement at every stage of research planning, design and execution; team-based data science; as well as harnessing novel and secure data technologies. Applying these values to health data science will safeguard a social license for health data research, and ensure transparent and secure data usage for public benefit….(More)”.

PayStats helps assess the impact of the low-emission area Madrid Central


BBVA API Market: “How do town-planning decisions affect a city’s routines? How can data help assess and make decisions? The granularity and detailed information offered by PayStats allowed Madrid’s city council to draw a more accurate map of consumer behavior and gain an objective measurement of the impact of the traffic restriction measures on commercial activity.

In this case, 20 million aggregate and anonymized transactions with BBVA cards and any other card at BBVA POS terminals were analyzed to study the effect of the changes made by Madrid’s city council to road access to the city center.

The BBVA PayStats API is targeted at all kinds of organizations including the public sector, as in this case. Madrid’s city council used it to find out how restricting car access to Madrid Central impacted Christmas shopping. From information gathered between December 1 2018 and January 7 2019, a comparison was made between data from the last two Christmases as well as the increased revenue in Madrid Central (Gran Vía and five subareas) vs. the increase in the entire city.

According to the report drawn up by council experts, 5.984 billion euros were spent across the city. The sample shows a 3.3% increase in spending in Madrid when compared to the same time the previous year; this goes up to 9.5% in Gran Vía and reaches 8.6% in the central area….(More)”.

How data collected from mobile phones can help electricity planning


Article by Eduardo Alejandro Martínez Ceseña, Joseph Mutale, Mathaios Panteli, and Pierluigi Mancarella in The Conversation: “Access to reliable and affordable electricity brings many benefits. It supports the growth of small businesses, allows students to study at night and protects health by offering an alternative cooking fuel to coal or wood.

Great efforts have been made to increase electrification in Africa, but rates remain low. In sub-Saharan Africa only 42% of urban areas have access to electricity, just 22% in rural areas.

This is mainly because there’s not enough sustained investment in electricity infrastructure, many systems can’t reliably support energy consumption or the price of electricity is too high.

Innovation is often seen as the way forward. For instance, cheaper and cleaner technologies, like solar storage systems deployed through mini grids, can offer a more affordable and reliable option. But, on their own, these solutions aren’t enough.

To design the best systems, planners must know where on- or off-grid systems should be placed, how big they need to be and what type of energy should be used for the most effective impact.

The problem is reliable data – like village size and energy demand – needed for rural energy planning is scarce or non-existent. Some can be estimated from records of human activities – like farming or access to schools and hospitals – which can show energy needs. But many developing countries have to rely on human activity data from incomplete and poorly maintained national census. This leads to inefficient planning.

In our research we found that data from mobile phones offer a solution. They provide a new source of information about what people are doing and where they’re located.

In sub-Saharan Africa, there are more people with mobile phones than access to electricity, as people are willing to commute to get a signal and/or charge their phones.

This means that there’s an abundance of data – that’s constantly updated and available even in areas that haven’t been electrified – that could be used to optimise electrification planning….

We were able to use mobile data to develop a countrywide electrification strategy for Senegal. Although Senegal has one of the highest access to electricity rates in sub-Saharan Africa, just 38% of people in rural areas have access.

By using mobile data we were able to identify the approximate size of rural villages and access to education and health facilities. This information was then used to size and cost different electrification options and select the most economic one for each zone – whether villages should be connected to the grids, or where off-grid systems – like solar battery systems – were a better option.

To collect the data we randomly selected mobile phone data from 450,000 users from Senegal’s main telecomms provider, Sonatel, to understand exactly how information from mobile phones could be used. This includes the location of user and the characteristics of the place they live….(More)”

Data Trusts as an AI Governance Mechanism


Paper by Chris Reed and Irene YH Ng: “This paper is a response to the Singapore Personal Data Protection Commission consultation on a draft AI Governance Framework. It analyses the five data trust models proposed by the UK Open Data Institute and identifies that only the contractual and corporate models are likely to be legally suitable for achieving the aims of a data trust.

The paper further explains how data trusts might be used as in the governance of AI, and investigates the barriers which Singapore’s data protection law presents to the use of data trusts and how those barriers might be overcome. Its conclusion is that a mixed contractual/corporate model, with an element of regulatory oversight and audit to ensure consumer confidence that data is being used appropriately, could produce a useful AI governance tool…(More)”.

Visualizing where rich and poor people really cross paths—or don’t


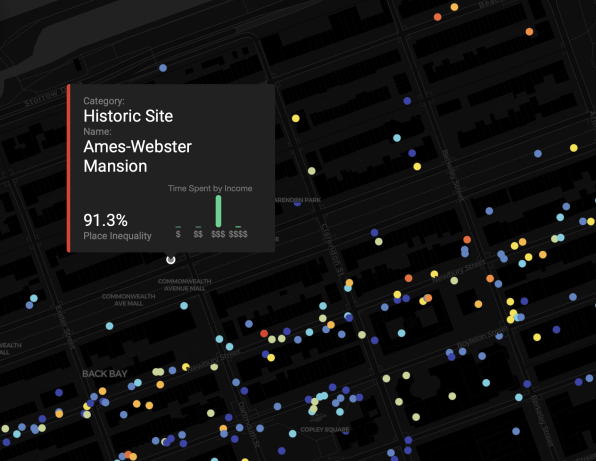
Ben Paynter at Fast Company: “…It’s an idea that’s hard to visualize unless you can see it on a map. So MIT Media Lab collaborated with the location intelligence firm Cuebiqto build one. The result is called the Atlas of Inequality and harvests the anonymized location data from 150,000 people who opted in to Cuebiq’s Data For Good Initiative to track their movement for scientific research purposes. After isolating the general area (based on downtime) where each subject lived, MIT Media Lab could estimate what income bracket they occupied. The group then used data from a six-month period between late 2016 and early 2017 to figure out where these people traveled, and how their paths overlapped.

[Screenshot: Atlas of Inequality]

The result is an interactive view of just how filtered, sheltered, or sequestered many people’s lives really are. That’s an important thing to be reminded of at a time when the U.S. feels increasingly ideologically and economically divided. “Economic inequality isn’t just limited to neighborhoods, it’s part of the places you visit every day,” the researchers say in a mission statement about the Atlas….(More)”.