Transforming government through digitization


Bjarne Corydon, Vidhya Ganesan, and Martin Lundqvist at McKinsey: “By digitizing processes and making organizational changes, governments can enhance services, save money, and improve citizens’ quality of life.

As companies have transformed themselves with digital technologies, people are calling on governments to follow suit. By digitizing, governments can provide services that meet the evolving expectations of citizens and businesses, even in a period of tight budgets and increasingly complex challenges. Our estimates suggest that government digitization, using current technology, could generate over $1 trillion annually worldwide.

Digitizing a government requires attention to two major considerations: the core capabilities for engaging citizens and businesses, and the organizational enablers that support those capabilities (exhibit). These make up a framework for setting digital priorities. In this article, we look at the capabilities and enablers in this framework, along with guidelines and real-world examples to help governments seize the opportunities that digitization offers.

A digital government has core capabilities supported by organizational enablers.

Governments typically center their digitization efforts on four capabilities: services, processes, decisions, and data sharing. For each, we believe there is a natural progression from quick wins to transformative efforts….(More)”

See also: Digital by default: A guide to transforming government (PDF–474KB) and  “Never underestimate the importance of good government,”  a New at McKinsey blog post with coauthor Bjarne Corydon, director of the McKinsey Center for Government.

Beyond nudging: it’s time for a second generation of behaviourally-informed social policy


Katherine Curchin at LSE Blog: “…behavioural scientists are calling for a second generation of behaviourally-informed policy. In some policy areas, nudges simply aren’t enough. Behavioural research shows stronger action is required to attack the underlying cause of problems. For example, many scholars have argued that behavioural insights provide a rationale for regulation to protect consumers from manipulation by private sector companies. But what might a second generation of behaviourally-informed social policy look like?

Behavioural insights could provide a justification to change the trajectory of income support policy. Since the 1990s policy attention has focused on the moral character of benefits recipients. Inspired by Lawrence Mead’s paternalist philosophy, governments have tried to increase the resolve of the unemployed to work their way out of poverty. More and more behavioural requirements have been attached to benefits to motivate people to fulfil their obligations to society.

But behavioural research now suggests that these harsh policies are misguided. Behavioural science supports the idea that people often make poor decisions and do things which are not in their long term interests.  But the weakness of individuals’ moral constitution isn’t so much the problem as the unequal distribution of opportunities in society. There are circumstances in which humans are unlikely to flourish no matter how motivated they are.

Normal human psychological limitations – our limited cognitive capacity, limited attention and limited self-control – interact with environment to produce the behaviour that advocates of harsh welfare regimes attribute to permissive welfare. In their book Scarcity, Sendhil Mullainathan and Eldar Shafir argue that the experience of deprivation creates a mindset that makes it harder to process information, pay attention, make good decisions, plan for the future, and resist temptations.

Importantly, behavioural scientists have demonstrated that this mindset can be temporarily created in the laboratory by placing subjects in artificial situations which induce the feeling of not having enough. As a consequence, experimental subjects from middle-class backgrounds suddenly display the short-term thinking and irrational decision making often attributed to a culture of poverty.

Tying inadequate income support to a list of behavioural conditions will most punish those who are suffering most. Empirical studies of welfare conditionality have found that benefit claimants often do not comprehend the complicated rules that apply to them. Some are being punished for lack of understanding rather than deliberate non-compliance.

Behavioural insights can be used to mount a case for a more generous, less punitive approach to income support. The starting point is to acknowledge that some of Mead’s psychological assumptions have turned out to be wrong. The nature of the cognitive machinery humans share imposes limits on how self-disciplined and conscientious we can reasonably expect people living in adverse circumstances to be. We have placed too much emphasis on personal responsibility in recent decades. Why should people internalize the consequences of their behaviour when this behaviour is to a large extent the product of their environment?…(More)”

Crowdsourcing Gun Violence Research


Penn Engineering: “Gun violence is often described as an epidemic, but as visible and shocking as shooting incidents are, epidemiologists who study that particular source of mortality have a hard time tracking them. The Centers for Disease Control is prohibited by federal law from conducting gun violence research, so there is little in the way of centralized infrastructure to monitor where, how,when, why and to whom shootings occur.

Chris Callison-Burch, Aravind K.Joshi Term Assistant Professor in Computer and InformationScience, and graduate studentEllie Pavlick are working to solve this problem.

They have developed the GunViolence Database, which combines machine learning and crowdsourcing techniques to produce a national registry of shooting incidents. Callison-Burch and Pavlick’s algorithm scans thousands of articles from local newspaper and television stations,determines which are about gun violence, then asks everyday people to pullout vital statistics from those articles, compiling that information into a unified, open database.

For natural language processing experts like Callison-Burch and Pavlick, the most exciting prospect of this effort is that it is training computer systems to do this kind of analysis automatically. They recently presented their work on that front at Bloomberg’s Data for Good Exchange conference.

The Gun Violence Database project started in 2014, when it became the centerpiece of Callison-Burch’s “Crowdsourcing and Human Computation”class. There, Pavlick developed a series of homework assignments that challenged undergraduates to develop a classifier that could tell whether a given news article was about a shooting incident.

“It allowed us to teach the things we want students to learn about datascience and natural language processing, while giving them the motivation to do a project that could contribute to the greater good,” says Callison-Burch.

The articles students used to train their classifiers were sourced from “TheGun Report,” a daily blog from New York Times reporters that attempted to catalog shootings from around the country in the wake of the Sandy Hook massacre. Realizing that their algorithmic approach could be scaled up to automate what the Times’ reporters were attempting, the researchers began exploring how such a database could work. They consulted with DouglasWiebe, a Associate Professor of Epidemiology in Biostatistics andEpidemiology in the Perelman School of Medicine, to learn more about what kind of information public health researchers needed to better study gun violence on a societal scale.

From there, the researchers enlisted people to annotate the articles their classifier found, connecting with them through Mechanical Turk, Amazon’scrowdsourcing platform, and their own website, http://gun-violence.org/…(More)”

For Better Citizenship, Scratch and Win


Tina Rosenberg in the New York Times: “China, with its largely cash economy, has a huge problem with tax evasion. Not just grand tax evasion, but the everyday “no receipt, please” kind, even though there have been harsh penalties: Before 2011, some forms of tax evasion were even punishable by death.

The country needed a different approach. So what did it do to get people to pay sales tax?
A. Hired a force of inspectors to raid restaurants and stores to catch people skipping the receipt, accompanied by big fines and prison terms.
B. Started an “It’s a citizen’s duty to denounce” exhortation campaign.
C. Installed cameras to photograph every transaction.
D. Turned receipts into scratch-off lottery games.

One of these things is not like the other, and that’s the answer: D. Instead of punishing under-the-table transactions, China wisely decided to encouragelegal transactions by starting a receipt lottery. Many places have done this — Brazil, Chile, Malta, Portugal, Slovakia and Taiwan, among others. In Taiwan, for example, every month the tax authorities post lottery numbers; match a few numbers for a small prize, or all of them to win more than $300,000.

China took it further. Customers need not store their receipts and wait until the end of the month to see if they’ve won money. Gratification is instant: Each receipt, known as a fapiao, is a scratch-off lottery ticket. People still game the system, but much less. The fapiao system has greatly raised collections of sales tax, business income tax and total tax. And it’s cheap to administer: one study found that new tax revenue totaled 30 times (PDF) the cost of the lottery prizes.

When a receipt is a lottery ticket, people ask for a receipt. They hope to get money, but just as important, they like to play games. Those axioms apply around the globe.

“We have groups that say: we can give out an incentive to our customers worth $15,” said Aron Ezra, chief executive of OfferCraft, an American company that designs games for businesses. “They could do that and have everyone get an incentive for $15. But they’d get better results for the same average price by having variability — some get $10, some get $100.” The lottery makes it exciting.

The huge popularity of lotteries shows this. Another example is the Save to Win program, which credit unions are using in seven states. Microscopic interest rates weren’t enough to get low-income customers to save. So instead, for every $25 they put into a savings account, depositors get one lottery entry. They can win a grand prize — in some states, $10,000 — or $100 prizes every month.

What else could lotteries do?

Los Angeles and Philadelphia have been the sites of experiments to increase dismal voter turnout in local elections by choosing a voter at random to win a large cash prize. In May 2015, the Southwest Voter Registration Education Project in Los Angeles offered $25,000 to a random voter in one district during a school board election, in a project named Voteria.

Health-related lotteries aren’t new. In 1957, Glasgow held a mass X-ray campaign to diagnose tuberculosis. Health officials aimed to X-ray 250,000 people and in the end got three times that many. One reason for the enthusiasm: a weekly prize draw. A lovely vintage newsreel reported on the campaign.

More than 50 years later, researchers set up a lottery among young adults in Lesotho, designed to promote safe sex practices. Every four months the subjects were tested for two sexually transmitted diseases, syphilis and trichonomiasis. A negative test got them entered into a lottery to win either $50 (equivalent to a week’s average salary) or $100. The idea was to see if incentives to reduce the spread of syphilis would also protect against HIV.

The results were significant — a 21.4 percent reduction in the rate of new H.I.V. infections, and a 3.4 percent lower prevalence rate of HIV in the treatment group after two years. And the effect was lasting — the gains persisted a year after the experiment ended. The lottery worked in large part because it was most attractive to those most at risk: many people who take sexual risks also enjoy taking monetary risks, and might be eager to play a lottery.

The authors wrote in a blog post: “To the best of our knowledge, this is the first H.I.V. prevention intervention focusing on sexual behavior changes (as opposed to medical interventions) to have been demonstrated to lead to a significant reduction in H.I.V. incidence, the ultimate objective of any H.I.V. prevention intervention.”…(More)”

Designing the Next Generation of Open Data Policy


Andrew Young and Stefaan Verhulst at the Open Data Charter Blog: “The international Open Data Charter has emerged from the global open data community as a galvanizing document to place open government data directly in the hands of citizens and organizations. To drive this process forward, and ensure that the outcomes are both systemic and transformational, new open data policy needs to be based on evidence of how and when open data works in practice. To support this work, the GovLab, in collaboration with Omidyar Network, has recently completed research which provides vital evidence of open data projects around the world, including an analysis of 19 in-depth, impact-focused case studies and a key findings paper. All of the research is now available in an eBook published by O’Reilly Media.

The research found that open data is making an impact in four core ways, including:…(More)”

Living in the World of Both/And


Essay by Adene Sacks & Heather McLeod Grant  in SSIR: “In 2011, New York Times data scientist Jake Porway wrote a blog post lamenting the fact that most data scientists spend their days creating apps to help users find restaurants, TV shows, or parking spots, rather than addressing complicated social issues like helping identify which teens are at risk of suicide or creating a poverty index of Africa using satellite data.

That post hit a nerve. Data scientists around the world began clamoring for opportunities to “do good with data.” Porway—at the center of this storm—began to convene these scientists and connect them to nonprofits via hackathon-style events called DataDives, designed to solve big social and environmental problems. There was so much interest, he eventually quit his day job at the Times and created the organization DataKind to steward this growing global network of data science do-gooders.

At the same time, in the same city, another movement was taking shape—#GivingTuesday, an annual global giving event fueled by social media. In just five years, #GivingTuesday has reshaped how nonprofits think about fundraising and how donors give. And yet, many don’t know that 92nd Street Y (92Y)—a 140-year-old Jewish community and cultural center in Manhattan, better known for its star-studded speaker series, summer camps, and water aerobics classes—launched it.

What do these two examples have in common? One started as a loose global network that engaged data scientists in solving problems, and then became an organization to help support the larger movement. The other started with a legacy organization, based at a single site, and catalyzed a global movement that has reshaped how we think about philanthropy. In both cases, the founding groups have incorporated the best of both organizations and networks.

Much has been written about the virtues of thinking and acting collectively to solve seemingly intractable challenges. Nonprofit leaders are being implored to put mission above brand, build networks not just programs, and prioritize collaboration over individual interests. And yet, these strategies are often in direct contradiction to the conventional wisdom of organization-building: differentiating your brand, developing unique expertise, and growing a loyal donor base.

A similar tension is emerging among network and movement leaders. These leaders spend their days steering the messy process required to connect, align, and channel the collective efforts of diverse stakeholders. It’s not always easy: Those searching to sustain movements often cite the lost momentum of the Occupy movement as a cautionary note. Increasingly, network leaders are looking at how to adapt the process, structure, and operational expertise more traditionally associated with organizations to their needs—but without co-opting or diminishing the energy and momentum of their self-organizing networks…

Welcome to the World of “Both/And”

Today’s social change leaders—be they from business, government, or nonprofits—must learn to straddle the leadership mindsets and practices of both networks and organizations, and know when to use which approach. Leaders like Porway, and Henry Timms and Asha Curran of 92Y can help show us the way.

How do these leaders work with the “both/and” mindset?

First, they understand and leverage the strengths of both organizations and networks—and anticipate their limitations. As Timms describes it, leaders need to be “bilingual” and embrace what he has called “new power.” Networks can be powerful generators of new talent or innovation around complex multi-sector challenges. It’s useful to take a network approach when innovating new ideas, mobilizing and engaging others in the work, or wanting to expand reach and scale quickly. However, networks can dissipate easily without specific “handrails,” or some structure to guide and support their work. This is where they need some help from the organizational mindset and approach.

On the flip side, organizations are good at creating centralized structures to deliver products or services, manage risk, oversee quality control, and coordinate concrete functions like communications or fundraising. However, often that efficiency and effectiveness can calcify over time, becoming a barrier to new ideas and growth opportunities. When organizational boundaries are too rigid, it is difficult to engage the outside world in ideating or mobilizing on an issue. This is when organizations need an infusion of the “network mindset.”


…(More)

How to advance open data research: Towards an understanding of demand, users, and key data


Danny Lämmerhirt and Stefaan Verhulst at IODC blog: “…Lord Kelvin’s famous quote “If you can not measure it, you can not improve it” equally applies to open data. Without more evidence of how open data contributes to meeting users’ needs and addressing societal challenges, efforts and policies toward releasing and using more data may be misinformed and based upon untested assumptions.

When done well, assessments, metrics, and audits can guide both (local) data providers and users to understand, reflect upon, and change how open data is designed. What we measure and how we measure is therefore decisive to advance open data.

Back in 2014, the Web Foundation and the GovLab at NYU brought together open data assessment experts from Open Knowledge, Organisation for Economic Co-operation and Development, United Nations, Canada’s International Development Research Centre, and elsewhere to explore the development of common methods and frameworks for the study of open data. It resulted in a draft template or framework for measuring open data. Despite the increased awareness for more evidence-based open data approaches, since 2014 open data assessment methods have only advanced slowly. At the same time, governments publish more of their data openly, and more civil society groups, civil servants, and entrepreneurs employ open data to manifold ends: the broader public may detect environmental issues and advocate for policy changes, neighbourhood projects employ data to enable marginalized communities to participate in urban planning, public institutions may enhance their information exchange, and entrepreneurs embed open data in new business models.

In 2015, the International Open Data Conference roadmap made the following recommendations on how to improve the way we assess and measure open data.

  1. Reviewing and refining the Common Assessment Methods for Open Data framework. This framework lays out four areas of inquiry: context of open data, the data published, use practices and users, as well as the impact of opening data.
  2. Developing a catalogue of assessment methods to monitor progress against the International Open Data Charter (based on the Common Assessment Methods for Open Data).
  3. Networking researchers to exchange common methods and metrics. This helps to build methodologies that are reproducible and increase credibility and impact of research.
  4. Developing sectoral assessments.

In short, the IODC called for refining our assessment criteria and metrics by connecting researchers, and applying the assessments to specific areas. It is hard to tell how much progress has been made in answering these recommendations, but there is a sense among researchers and practitioners that the first two goals are yet to be fully addressed.

Instead we have seen various disparate, yet well meaning, efforts to enhance the understanding of the release and impact of open data. A working group was created to measure progress on the International Open Data Charter, which provides governments with principles for implementing open data policies. While this working group compiled a list of studies and their methodologies, it did not (yet) deepen the common framework of definitions and criteria to assess and measure the implementation of the Charter.

In addition, there is an increase of sector- and case-specific studies that are often more descriptive and context specific in nature, yet do contribute to the need for examples that illustrate the value proposition for open data.

As such, there seems to be a disconnect between top-level frameworks and on-the-ground research, preventing the sharing of common methods and distilling replicable experiences about what works and what does not….(More)”

Data for Policy: Data Science and Big Data in the Public Sector


Innar Liiv at OXPOL: “How can big data and data science help policy-making? This question has recently gained increasing attention. Both the European Commission and the White House have endorsed the use of data for evidence-based policy making.

Still, a gap remains between theory and practice. In this blog post, I make a number of recommendations for systematic development paths.

RESEARCH TRENDS SHAPING DATA FOR POLICY

‘Data for policy’ as an academic field is still in its infancy. A typology of the field’s foci and research areas are summarised in the figure below.


diagram1


Besides the ‘data for policy’ community, there are two important research trends shaping the field: 1) computational social science; and 2) the emergence of politicised social bots.

Computational social science (CSS) is an new interdisciplinary research trend in social science, which tries to transform advances in big data and data science into research methodologies for understanding, explaining and predicting underlying social phenomena.

Social science has a long tradition of using computational and agent-based modelling approaches (e.g.Schelling’s Model of Segregation), but the new challenge is to feed real-life, and sometimes even real-time information into those systems to get gain rapid insights into the validity of research hypotheses.

For example, one could use mobile phone call records to assess the acculturation processes of different communities. Such a project would involve translating different acculturation theories into computational models, researching the ethical and legal issues inherent in using mobile phone data and developing a vision for generating policy recommendations and new research hypothesis from the analysis.

Politicised social bots are also beginning to make their mark. In 2011, DARPA solicited research proposals dealing with social media in strategic communication. The term ‘political bot’ was not used, but the expected results left no doubt about the goals…

The next wave of e-government innovation will be about analytics and predictive models.  Taking advantage of their potential for social impact will require a solid foundation of e-government infrastructure.

The most important questions going forward are as follows:

  • What are the relevant new data sources?
  • How can we use them?
  • What should we do with the information? Who cares? Which political decisions need faster information from novel sources? Do we need faster information? Does it come with unanticipated risks?

These questions barely scratch the surface, because the complex interplay between general advancements of computational social science and hovering satellite topics like political bots will have an enormous impact on research and using data for policy. But, it’s an important start….(More)”

5 Crowdsourced News Platforms Shaping The Future of Journalism and Reporting


 at Crowdsourcing Week: “We are exposed to a myriad of news and updates worldwide. As the crowd becomes moreinvolved in providing information, adopting that ‘upload mindset’ coined by Will Merritt ofZooppa, access to all kinds of data is a few taps and clicks away….

Google News Lab – Better reporting and insightful storytelling

crowdsourced-news-platforms-googlenewslabs

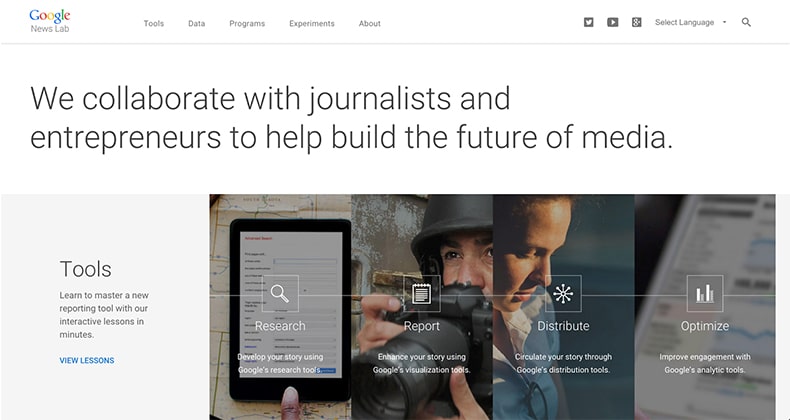
Last week, Google announced its own crowdsourced news platform dubbed News Lab as part of their efforts “to empower innovation at the intersection of technology and media.”

Scouting for real-time stories, updates, and breaking news is much easier and systematize for journalists worldwide. They can use Google’s tools for better reporting, data for insightful storytelling and programs to focus on the future of media, tackling this initiative in three ways.

“There’s a revolution in data journalism happening in newsrooms today, as more data sets and more tools for analysis are allowing journalists to create insights that were never before possible,” Google said.

Grasswire – first-hand information in real-time

crowdsourced-news-platforms-grasswire

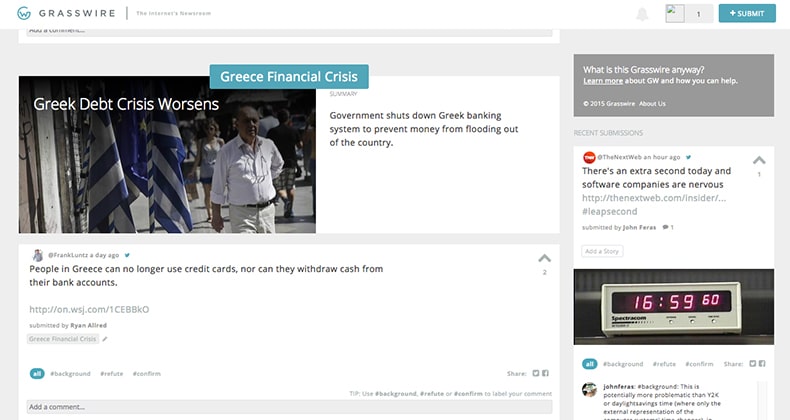
The design looks bleak and simple, but the site itself is rich with content—first-hand information crowdsourced from Twitter users in real-time and verified. Austen Allred, co-founder of Grasswire was inspired to develop the platform after his “minor slipup” as the American Journalism Review (AJR) puts it, when he missed his train out of Shanghai that actually saved his life.

“The bullet train Allred was supposed to be on collided with another train in the Wenzhou area ofChina’s Zhejiang province,” AJR wrote. “Of the 1,630 passengers, 40 died, and another 210 were injured.” The accident happened in 2011. Unfortunately, the Chinese government made some cover upon the incident, which frustrated Allred in finding first-hand information.

After almost four years, Grasswire was launched, a website that collects real-time information from users for breaking news infused with crowdsourcing model afterward. “It’s since grown into a more complex interface, allowing users to curate selected news tweets by voting and verifying information with a fact-checking system,” AJR wrote, which made the verification of data open and systematized.

Rappler – Project Agos: a technology for disaster risk reduction

crowdsourced-news-platforms-projectagos

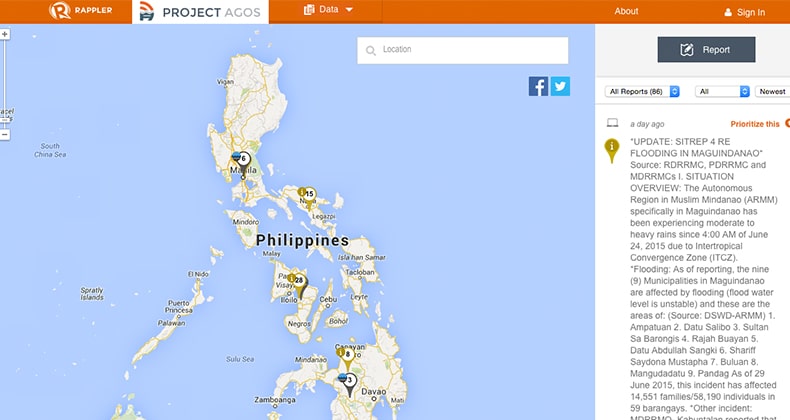
The Philippines is a favorite hub for typhoons. The aftermath of typhoon Haiyan was exceedingly disastrous. But the crowds were steadfast in uploading and sharing information and crowdsourcing became mainstream during the relief operations. Maria Ressa said that they had to educate netizens to use the appropriate hashtags for years (#nameoftyphoonPH, e.g. #YolandaPH) for typhoons to collect data on social media channels easily.

Education and preparation can mitigate the risks and save lives if we utilize the right technology and act accordingly. In her blog, After Haiyan: Crisis management and beyond, Maria wrote, “We need to educate not just the first responders and local government officials, but more importantly, the people in the path of the storms.” …

China’s CCDI app – Crowdsourcing political reports to crack down corruption practices

crowdsourced-news-platforms-ccdiapp

In China, if you want to mitigate or possible, eradicate corrupt practices, then there’s an app for that.China launched its own anti-corruption app called, Central Commission for Discipline InspectionWebsite App, allowing the public to upload text messages, photos and videos of Chinese officials’ any corrupt practices.

The platform was released by the government agency, Central Committee for Discipline Inspection.Nervous in case you’ll be tracked as a whistleblower? Interestingly, anyone can report anonymously.China Daily said, “the anti-corruption authorities received more than 1,000 public reports, and nearly70 percent were communicated via snapshots, text messages or videos uploaded,” since its released.Kenya has its own version, too, called Ushahidi using crowdmapping, and India’s I Paid a Bribe.

Newzulu – share news, publish and get paid

crowdsourced-news-platforms-newzulu

While journalists can get fresh insights from Google News Labs, the crowd can get real-time verified news from Grasswire, and CCDI is open for public, Newzulu crowdsourced news platforms doesn’t just invite the crowd to share news, they can also publish and get paid.

It’s “a community of over 150,000 professional and citizen journalists who share and break news to the world as it happens,” originally based in Sydney. Anyone can submit stories, photos, videos, and even stream live….(More)”

Revealing Algorithmic Rankers


Julia Stoyanovich and Ellen P. Goodman in the Freedom to Tinker Blog: “ProPublica’s story on “machine bias” in an algorithm used for sentencing defendants amplified calls to make algorithms more transparent and accountable. It has never been more clear that algorithms are political (Gillespie) and embody contested choices (Crawford), and that these choices are largely obscured from public scrutiny (Pasquale and Citron). We see it in controversies over Facebook’s newsfeed, or Google’s search results, or Twitter’s trending topics. Policymakers are considering how to operationalize “algorithmic ethics” and scholars are calling for accountable algorithms (Kroll, et al.).

One kind of algorithm that is at once especially obscure, powerful, and common is the ranking algorithm (Diakopoulos). Algorithms rank individuals to determine credit worthiness, desirability for college admissions and employment, and compatibility as dating partners. They encode ideas of what counts as the best schools, neighborhoods, and technologies. Despite their importance, we actually can know very little about why this person was ranked higher than another in a dating app, or why this school has a better rank than that one. This is true even if we have access to the ranking algorithm, for example, if we have complete knowledge about the factors used by the ranker and their relative weights, as is the case for US News ranking of colleges. In this blog post, we argue that syntactic transparency, wherein the rules of operation of an algorithm are more or less apparent, or even fully disclosed, still leaves stakeholders in the dark: those who are ranked, those who use the rankings, and the public whose world the rankings may shape.

Using algorithmic rankers as an example, we argue that syntactic transparency alone will not lead to true algorithmic accountability (Angwin). This is true even if the complete input data is publicly available. We advocate instead for interpretability, which rests on making explicit the interactions between the program and the data on which it acts. An interpretable algorithm allows stakeholders to understand the outcomes, not merely the process by which outcomes were produced….

Opacity in algorithmic rankers can lead to four types of harms:

(1) Due process / fairness. The subjects of the ranking cannot have confidence that their ranking is meaningful or correct, or that they have been treated like similarly situated subjects. Syntactic transparency helps with this but it will not solve the problem entirely, especially when people cannot interpret how weighted factors have impacted the outcome (Source 2 above).

(2) Hidden normative commitments. A ranking formula implements some vision of the “good.” Unless the public knows what factors were chosen and why, and with what weights assigned to each, it cannot assess the compatibility of this vision with other norms. Even where the formula is disclosed, real public accountability requires information about whether the outcomes are stable, whether the attribute weights are meaningful, and whether the outcomes are ultimately validated against the chosen norms. Did the vendor evaluate the actual effect of the features that are postulated as important by the scoring / ranking mode? Did the vendor take steps to compensate for mutually-reinforcing correlated inputs, and for possibly discriminatory inputs? Was stability of the ranker interrogated on real or realistic inputs? This kind of transparency around validation is important for both learning algorithms which operate according to rules that are constantly in flux and responsive to shifting data inputs, and for simpler score-based rankers that are likewise sensitive to the data.

(3) Interpretability. Especially where ranking algorithms are performing a public function (e.g., allocation of public resources or organ donations) or directly shaping the public sphere (e.g., ranking politicians), political legitimacy requires that the public be able to interpret algorithmic outcomes in a meaningful way. At the very least, they should know the degree to which the algorithm has produced robust results that improve upon a random ordering of the items (a ranking-specific confidence measure). In the absence of interpretability, there is a threat to public trust and to democratic participation, raising the dangers of an algocracy (Danaher) – rule by incontestable algorithms.

(4) Meta-methodological assessment. Following on from the interpretability concerns is a meta question about whether a ranking algorithm is the appropriate method for shaping decisions. There are simply some domains, and some instances of datasets, in which rank order is not appropriate. For example, if there are very many ties or near-ties induced by the scoring function, or if the ranking is too unstable, it may be better to present data through an alternative mechanism such as clustering. More fundamentally, we should question the use of an algorithmic process if its effects are not meaningful or if it cannot be explained. In order to understand whether the ranking methodology is valid, as a first order question, the algorithmic process needs to be interpretable….

The Ranking Facts show how the properties of the 10 highest-ranked items compare to the entire dataset (Relativity), making explicit cases where the ranges of values, and the median value, are different at the top-10 vs. overall (median is marked with red triangles for faculty size and average publication count). The label lists the attributes that have most impact on the ranking (Impact), presents the scoring formula (if known), and explains which attributes correlate with the computed score. Finally, the label graphically shows the distribution of scores (Stability), explaining that scores differ significantly up to top-10 but are nearly indistinguishable in later positions.

Something like the Rankings Facts makes the process and outcome of algorithmic ranking interpretable for consumers, and reduces the likelihood of opacity harms, discussed above. Beyond Ranking Facts, it is important to develop Interpretability tools that enable vendors to design fair, meaningful and stable ranking processes, and that support external auditing. Promising technical directions include, e.g., quantifying the influence of various features on the outcome under different assumptions about availability of data and code, and investigating whether provenance techniques can be used to generate explanations….(More)”