Public Health Struggles to Get Rid of Its Data Silos


Article by Carl Smith: “…In September 2019, before the first COVID-19 case was reported in the U.S., the Council of State and Territorial Epidemiologists (CSTE) published a report calling for a “public health data superhighway” capable of detecting health challenges and informing the response to them.

The technology to accomplish this already exists, CSTE noted. But even so, “public health departments struggle to take advantage of these advancements and continue to rely on sluggish, manual processes like paper records, phone calls, spreadsheets, and faxes requiring manual data entry.”

The limitations of this data ecosystem became a considerable liability when public health officials ran up against a virus that had never been seen before, working to both understand and control it at the same time. “There were mixed messages, and the pandemic made us look like our data was not adequate to the task,” says Gail C. Christopher, executive director of the National Collaborative for Health Equity.

This provided an opening for political or social actors to push anti-public health campaigns that continue to fuel public distrust of public health leaders, workers and guidelines. Reliable and timely data could help heal some of the harm that has been done, says Christopher.

“I think every health department has aspects of a complete data system,” says Brian Castrucci, president and CEO of the DeBeaumont Foundation, which funded the CSTE report. “But we need to articulate what a complete data system looks like — right now, we don’t even know what the destination is, so it’s hard to tell when we’re lost.”

A Data Modernization Movement

Data systems improvement is one of three major topics that recur in discussions about rebuilding public health, along with workforce expansion and regaining public trust, says Michael Fraser, executive director of the Association of State and Territorial Health Officials (ASTHO). “A major finding from all the conversations that we’ve had about COVID is that data systems need to be modernized.”

In recent years, there has been considerable effort by the public health community to find ways to move away from “silo-based” or disease-based surveillance between states and the federal government to an enterprise-wide system, says Fraser. “During COVID, a lot of states had a hard time sharing data, and there are many parts of this country where people go back and forth between multiple states on any given day — it’s not just the ability for states to share data with the federal government, but for states to share amongst themselves.”

The CDC’s Data Modernization Initiative, launched in 2020, is a $1.2 billion effort to address this challenge, envisioning resilient, connected systems that could “solve problems before they happen and reduce the harm caused by the problems that do happen.” The CSTE campaign “Data: Elemental to Health” is working to ensure sustained public funding for this work…(More)”.

Why You Need an AI Ethics Committee


Article by Reid Blackman: “…There are a lot of well-documented and highly publicized ethical risks associated with AI; unintended bias and invasions of privacy are just two of the most notable kinds. In many instances the risks are specific to particular uses, like the possibility that self-driving cars will run over pedestrians or that AI-generated social media newsfeeds will sow distrust of public institutions. In some cases they’re major reputational, regulatory, financial, and legal threats. Because AI is built to operate at scale, when a problem occurs, it affects all the people the technology engages with—for instance, everyone who responds to a job listing or applies for a mortgage at a bank. If companies don’t carefully address ethical issues in planning and executing AI projects, they can waste a lot of time and money developing software that is ultimately too risky to use or sell, as many have already learned.

Your organization’s AI strategy needs to take into account several questions: How might the AI we design, procure, and deploy pose ethical risks that cannot be avoided? How do we systematically and comprehensively identify and mitigate them? If we ignore them, how much time and labor would it take us to respond to a regulatory investigation? How large a fine might we pay if found guilty, let alone negligent, of violating regulations or laws? How much would we need to spend to rebuild consumer and public trust, provided that money could solve the problem?

The answers to those questions will underscore how much your organization needs an AI ethical risk program. It must start at the executive level and permeate your company’s ranks—and, ultimately, the technology itself. In this article I’ll focus on one crucial element of such a program—an AI ethical risk committee—and explain why it’s critical that it include ethicists, lawyers, technologists, business strategists, and bias scouts. Then I’ll explore what that committee requires to be effective at a large enterprise.

But first, to provide a sense of why such a committee is so important, I’ll take a deep dive into the issue of discriminatory AI. Keep in mind that this is just one of the risks AI presents; there are many others that also need to be investigated in a systematic way…(More)”.

AI Can Predict Potential Nutrient Deficiencies from Space


Article by Rachel Berkowitz: “Micronutrient deficiencies afflict more than two billion people worldwide, including 340 million children. This lack of vitamins and minerals can have serious health consequences. But diagnosing deficiencies early enough for effective treatment requires expensive, time-consuming blood draws and laboratory tests.

New research provides a more efficient approach. Computer scientist Elizabeth Bondi and her colleagues at Harvard University used publicly available satellite data and artificial intelligence to reliably pinpoint geographical areas where populations are at high risk of micronutrient deficiencies. This analysis could potentially pave the way for early public health interventions.

Existing AI systems can use satellite data to predict localized food security issues, but they typically rely on directly observable features. For example, agricultural productivity can be estimated from views of vegetation. Micronutrient availability is harder to calculate. After seeing research showing that areas near forests tend to have better dietary diversity, Bondi and her colleagues were inspired to identify lesser-known markers for potential malnourishment. Their work shows that combining data such as vegetation cover, weather and water presence can suggest where populations will lack iron, vitamin B12 or vitamin A.

The team examined raw satellite measurements and consulted with local public health officials, then used AI to sift through the data and pinpoint key features. For instance, a food market, inferred based on roads and buildings visible, was vital for predicting a community’s risk level. The researchers then linked these features to specific nutrients lacking in four regions’ populations across Madagascar. They used real-world biomarker data (blood samples tested in labs) to train and test their AI program….(More)”.

How Period-Tracker Apps Treat Your Data, and What That Means if Roe v. Wade Is Overturned


Article by Nicole Nguyen and Cordilia James: “You might not talk to your friends about your monthly cycle, but there’s a good chance you talk to an app about it. And why not? Period-tracking apps are more convenient than using a diary, and the insights are more interesting, too. 

But how much do you know about the ways apps and trackers collect, store—and sometimes share—your fertility and menstrual-cycle data?

The question has taken on new importance following the leak of a draft Supreme Court opinion that would overturn Roe v. Wade. Roe established a constitutional right to abortion, and should the court reverse its 1973 decision, about half the states in the U.S. are likely to restrict or outright ban the procedure.

Phone and app data have long been shared and sold without prominent disclosure, often for advertising purposes. HIPAA, aka the Health Insurance Portability and Accountability Act, might protect information shared between you and your healthcare provider, but it doesn’t typically apply to data you put into an app, even a health-related one. Flo Health Inc., maker of a popular period and ovulation tracker, settled with the Federal Trade Commission in 2021 for sharing sensitive health data with Facebook without making the practice clear to users.

The company completed an independent privacy audit earlier this year. “We remain committed to ensuring the utmost privacy for our users and want to make it clear that Flo does not share health data with any company,” a spokeswoman said.

In a scenario where Roe is overturned, your digital breadcrumbs—including the kind that come from period trackers—could be used against you in states where laws criminalize aiding in or undergoing abortion, say legal experts.

“The importance of menstrual data is not merely speculative. It has been relevant to the government before, in investigations and restrictions,” said Leah Fowler, research director at University of Houston’s Health Law and Policy Institute. She cited a 2019 hearing where Missouri’s state health department admitted to keeping a spreadsheet of Planned Parenthood abortion patients, which included the dates of their last menstrual period.

Prosecutors have also obtained other types of digital information, including text messages and search histories, as evidence for abortion-related cases…(More)”.

Many researchers say they’ll share data — but don’t


Article by Clare Watson: “Most biomedical and health researchers who declare their willingness to share the data behind journal articles do not respond to access requests or hand over the data when asked, a study reports1.

Livia Puljak, who studies evidence-based medicine at the Catholic University of Croatia in Zagreb, and her colleagues analysed 3,556 biomedical and health science articles published in a month by 282 BMC journals. (BMC is part of Springer Nature, the publisher of Nature; Nature’s news team is editorially independent of its publisher.)

The team identified 381 articles with links to data stored in online repositories and another 1,792 papers for which the authors indicated in statements that their data sets would be available on reasonable request. The remaining studies stated that their data were in the published manuscript and its supplements, or generated no data, so sharing did not apply.

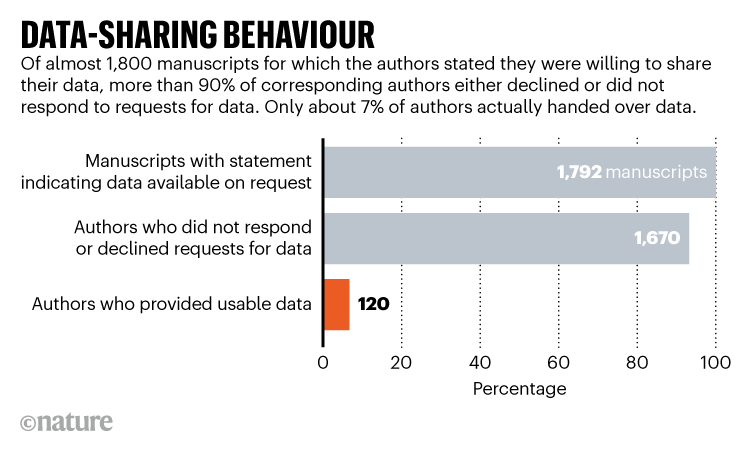
But of the 1,792 manuscripts for which the authors stated they were willing to share their data, more than 90% of corresponding authors either declined or did not respond to requests for raw data (see ‘Data-sharing behaviour’). Only 14%, or 254, of the contacted authors responded to e-mail requests for data, and a mere 6.7%, or 120 authors, actually handed over the data in a usable format. The study was published in the Journal of Clinical Epidemiology on 29 May.

DATA-SHARING BEHAVIOUR. Graphic showing percentage of authors that were willing to share data.
Source: Livia Puljak et al

Puljak was “flabbergasted” that so few researchers actually shared their data. “There is a gap between what people say and what people do,” she says. “Only when we ask for the data can we see their attitude towards data sharing.”

“It’s quite dismaying that [researchers] are not coming forward with the data,” says Rebecca Li, who is executive director of non-profit global data-sharing platform Vivli and is based in Cambridge, Massachusetts…(More)”.

China’s Expanding Surveillance State


Article by  Isabelle Qian, Muyi Xiao, Paul Mozur and Alexander Cardia in the New York Times: “China’s ambition to collect a staggering amount of personal data from everyday citizens is more expansive than previously known, a Times investigation has found. Phone-tracking devices are now everywhere. The police are creating some of the largest DNA databases in the world. And the authorities are building upon facial recognition technology to collect voice prints from the general public.

The Times’s Visual Investigations team and reporters in Asia spent over a year analyzing more than a hundred thousand government bidding documents. They call for companies to bid on the contracts to provide surveillance technology, and include product requirements and budget size, and sometimes describe at length the strategic thinking behind the purchases. Chinese laws stipulate that agencies must keep records of bids and make them public, but in reality the documents are scattered across hard-to-search web pages that are often taken down quickly without notice. ChinaFile, a digital magazine published by the Asia Society, collected the bids and shared them exclusively with The Times.

This unprecedented access allowed The Times to study China’s surveillance capabilities. The Chinese government’s goal is clear: designing a system to maximize what the state can find out about a person’s identity, activities and social connections, which could ultimately help the government maintain its authoritarian rule.

Here are the investigation’s major revelations.

Analysts estimate that more than half of the world’s nearly one billion surveillance cameras are in China, but it had been difficult to gauge how they were being used, what they captured and how much data they generated. The Times analysis found that the police strategically chose locations to maximize the amount of data their facial recognition cameras could collect…

The Chinese authorities are realistic about their technological limitations. According to one bidding document, the Ministry of Public Security, China’s top police agency, believed the country’s video surveillance systems still lacked analytical capabilities. One of the biggest problems they identified was that the data had not been centralized….(More)”.

Meet the fact-checkers decoding Sri Lanka’s meltdown


Article by Nilesh Christopher: “On the evening of May 3, the atmosphere at Galle Face Green, an esplanade along the coastline of Sri Lanka’s capital city of Colombo, was carnivalesque. Parents strolled on sidewalks with toddlers hoisted on their shoulders. Teenagers wearing bandanas played the flute and blew plastic horns. People climbed atop makeshift podiums to address the crowds, greeted by scattered applause. 

The crowd of a few hundred was part of a series of protests that had been underway since mid-March, demanding the ouster of President Gotabaya Rajapaksa. For months, the country has been trapped in a brutal economic crisis: Sri Lanka is currently unable to pay for imports of essentials, such as food, medicines, and fuel. Populist tax cuts, an abrupt ban on fertilizer imports, decimated crop yields, and the collapse of tourism during the pandemic all helped to push the country into the worst economic crisis it has faced since gaining independence in 1948.

The island nation owes nearly $7 billion this year and has next to no foreign reserves left. “We don’t have any gas. We don’t have fuel and some food items. We lose power for three to four hours daily now,” Nalin Chamara, 42, a hotelier protesting with his family and children, told Rest of World. Meanwhile, the presidential family at one point controlled around 70% of the nation’s budget and ran it as a family business, spending billions of dollars of borrowed money on vanity projects, such as an extravagant airport and cricket stadium that now sit almost entirely unused.

Yudhanjaya Wijeratne walked among the Galle Face Green crowds, surveying the scene. He pointed out where demonstrators had jury-rigged their own electricity supply by welding solar panels atop an open truck and connecting them to a battery. The power generated was being used to charge over two dozen smartphones inside a big blue tent, which also contained a library housing 15,000 books. “This is what Sri Lankans will do if you let them build stuff. Fucking build infrastructure from scratch,” Wijeratne said. The protest featured a giant middle finger monument made of plastic bottles, directed at the Rajapaksas. “Our real educational export should be B.Sc. in protest,” Wijeratne said.

Wijeratne, 29 years old, is best known as the author of Numbercaste, a science fiction novel about a near-future world where people’s importance in society is decided based on the all-powerful Number, a credit score determined by their social circle and social network data. But he is also the chief executive of Watchdog, a research collective based in Colombo that uses fact-checking and open source intelligence (OSINT) methods to investigate Sri Lanka’s ongoing crisis. As part of its work, he and his 12-member team of coders, journalists, economists, and students track, time stamp, geolocate, and document videos of protests shared online.

Watchdog’s protest tracker has emerged as the most comprehensive online archive of the historic events unfolding in Sri Lanka. Its data set, which comprises 597 different protests and 49 conflicts, has been used by global news organizations to demonstrate the extent of public pushback.

“[Our] core mission is simple,” Wijeratne told Rest of World. “We want to help people understand the infrastructure they use. The concrete, the laws, the policies, and the social contracts that they live under. We want to help people understand the causality of how they came to be and how they operate.”…(More)”.

Satellites zoom in on cities’ hottest neighborhoods to help combat the urban heat island effect


Article by Daniel P. Johnson: “Spend time in a city in summer and you can feel the urban heat rising from the pavement and radiating from buildings. Cities are generally hotter than surrounding rural areas, but even within cities, some residential neighborhoods get dangerously warmer than others just a few miles away.

Within these “micro-urban heat islands,” communities can experience heat wave conditions well before officials declare a heat emergency.

I use Earth-observing satellites and population data to map these hot spots, often on projects with NASA. Satellites like the Landsat program have become crucial for pinpointing urban risks so cities can prepare for and respond to extreme heat, a top weather-related killer.

Among the many things we’ve been able to track with increasingly detailed satellite data is that the hottest neighborhoods are typically low-income and often have predominantly Black or Hispanic residents….

With rising global temperatures increasing the likelihood of dangerous heat waves, cities need to know which neighborhoods are at high risk. Excessive heat can lead to dehydration, heat exhaustion, heat stroke and even death with prolonged exposure, and the most at-risk residents often lack financial resources to adapt.

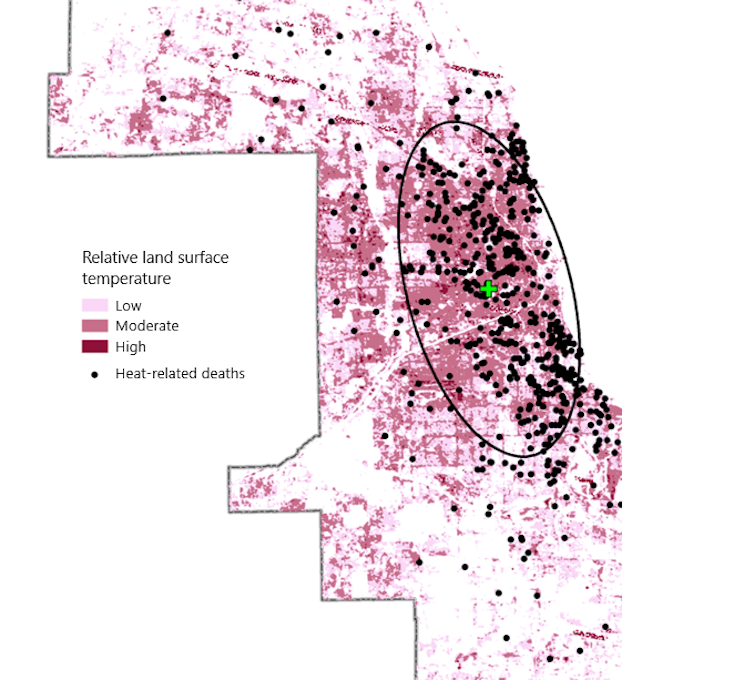
Map of Chicago showing how heat deaths clustered in the urban core during the 1995 heat wave.
The July 1995 Chicago heat wave was blamed for over 739 deaths in a five-day period. Most victims were poor and elderly people who lacked air conditioning or feared opening windows because of crime. This figure shows the location of heat-related deaths clustered in areas of higher surface urban heat intensity.

Satellite instruments can identify communities vulnerable to extreme heat because they can measure and map the surface urban heat island in high detail.

For example, industrial and commercial zones are frequently among the hottest areas in cities. They typically have fewer trees to cool the air and more pavement and buildings to retain and radiate heat…(More)”

Sweeping Legislation Aims to Ban the Sale of Location Data


Article by Joseph Cox and Liz Landers: “Sen. Elizabeth Warren and a group of other Democratic lawmakers have introduced a bill that would essentially outlaw the sale of location data harvested from smartphones. The bill also presents a range of other powers to the Federal Trade Commission (FTC) and individual victims to push back against the multibillion-dollar location data industry.

The move comes after Motherboard reported multiple instances in which companies were selling location data of people who visited abortion clinics, and sometimes making subsets of that data freely available. Such data has taken on a new significance in the wake of the Supreme Court’s looming vote on whether to overturn the protections offered by Roe v. Wade. The bill also follows a wave of reporting from Motherboard and others on various abuses and data sales in the location data industry writ large.

“Data brokers profit from the location data of millions of people, posing serious risks to Americans everywhere by selling their most private information,” Warren told Motherboard in a statement. “With this extremist Supreme Court poised to overturn Roe v. Wade and states seeking to criminalize essential health care, it is more crucial than ever for Congress to protect consumers’ sensitive data. The Health and Location Data Protection Act will ban brokers from selling Americans’ location and health data, rein in giant data brokers, and set some long overdue rules of the road for this $200 billion industry.”…(More)”.

Roadside safety messages increase crashes by distracting drivers


Article by Jonathan Hall and Joshua Madsen: “Behavioural interventions involve gently suggesting that people reconsider or change specific undesirable behaviours. They are a low-cost, easy-to-implement and increasingly common tool used by policymakers to encourage socially desirable behaviours.

Examples of behavioural interventions include telling people how their electricity usage compares to their neighbours or sending text messages reminding people to pay fines.

Many of these interventions are expressly designed to “seize people’s attention” at a time when they can take the desired action. Unfortunately, seizing people’s attention can crowd out other, more important considerations, and cause even a simple intervention to backfire with costly individual and social consequences.

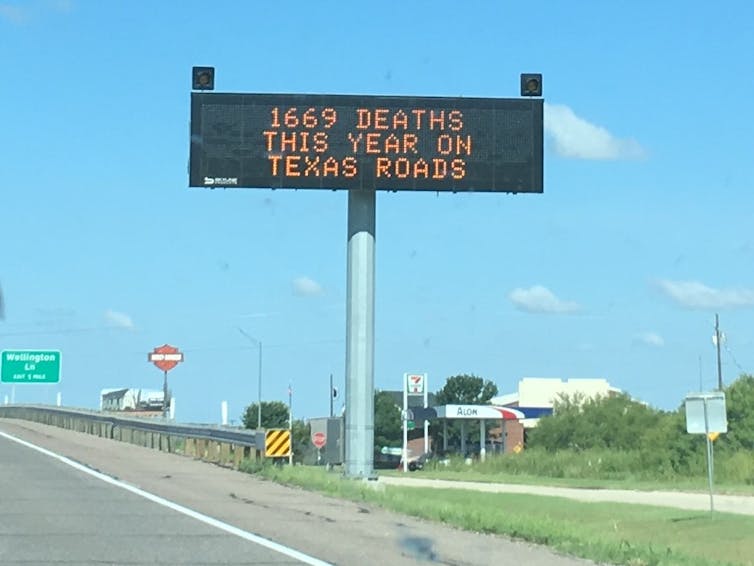
One such behavioural intervention struck us as odd: Several U.S. states display year-to-date fatality statistics (number of deaths) on roadside dynamic message signs (DMSs). The hope is that these sobering messages will reduce traffic crashesa leading cause of death of five- to 29-year-olds worldwide. Perhaps because of its low cost and ease of implementation, at least 28 U.S. states have displayed fatality statistics at least once since 2012. We estimate that approximately 90 million drivers have been exposed to such messages.

a road sign saying 1669 DEATHS THIS YEAR ON TEXAS ROADS
A roadside dynamic messaging sign in Texas, displaying the death toll from road crashes. (Jonathan Hall), Author provided

Startling results

As academic researchers with backgrounds in information disclosure and transportation policy, we teamed up to investigate and quantify the effects of these messages. What we found startled us.

Contrary to policymakers’ expectations (and ours), we found that displaying fatality messages increases the number of crashes…(More)”.