Power to the Public: The Promise of Public Interest Technology


Book by Tara Dawson McGuinness and Hana Schank: “As the speed and complexity of the world increases, governments and nonprofit organizations need new ways to effectively tackle the critical challenges of our time—from pandemics and global warming to social media warfare. In Power to the Public, Tara Dawson McGuinness and Hana Schank describe a revolutionary new approach—public interest technology—that has the potential to transform the way governments and nonprofits around the world solve problems. Through inspiring stories about successful projects ranging from a texting service for teenagers in crisis to a streamlined foster care system, the authors show how public interest technology can make the delivery of services to the public more effective and efficient.

At its heart, public interest technology means putting users at the center of the policymaking process, using data and metrics in a smart way, and running small experiments and pilot programs before scaling up. And while this approach may well involve the innovative use of digital technology, technology alone is no panacea—and some of the best solutions may even be decidedly low-tech.

Clear-eyed yet profoundly optimistic, Power to the Public presents a powerful blueprint for how government and nonprofits can help solve society’s most serious problems….(More)

Mapping Career Causeways


User Guide by Nesta: “This user guide shows how providers of careers information advice and guidance, policymakers and employers can use our innovative data tools to support workers and job seekers as they navigate the labour market.

Nesta’s Mapping Career Causeways project, supported by J.P. Morgan as part of their New Skills at Work initiative, applies state-of-the-art data science methods to create an algorithm that recommends job transitions and retraining to workers, with a focus on supporting those at high risk of automation. The algorithm works by measuring the similarity between over 1,600 jobs, displayed in our interactive ‘map of occupations’, based on the skills and tasks that make up each role.

Following the publication of the Mapping Career Causeways reportdata visualisation and open-source algorithm and codebase, we have developed a short user guide that demonstrates how you can take the insights and learnings from the Mapping Career Causeways project and implement them directly into your work….

The user guide shows how the Mapping Career Causeways research can be used to address common challenges identified by the stakeholders, such as:

  • Navigating the labour market can be overwhelming, and there is a need for a reliable source of insights (e.g. a tool) that helps to broaden a worker’s potential career opportunities whilst providing focused recommendations on the most valuable skills to invest in
  • There is no standardised data or a common ‘skills language’ to support career advice and guidance
  • There is a lack of understanding and clear data about which sectors are most at risk of automation, and which skills are most valuable for workers to invest in, in order to unlock lower-risk jobs
  • Most recruitment and transition practices rely heavily on relevant domain/sector experience and a worker’s contacts (i.e. who you know), and most employers do not take a skills-based approach to hiring
  • Fear, confidence and self esteem are significant barriers for workers to changing careers, in addition to barriers relating to time and finance
  • Localised information on training options, support for job seekers and live job opportunities would further enrich the model
  • Automation is just one of many trends that are changing the make-up and availability of jobs; other considerations such as digitalisation, the green transition, and regional factors must also be considered…(More)”.

Vancouver launches health data dashboard to drive collective action


Sarah Wray at Cities Today: “Vancouver has published a new open data dashboard to track progress against 23 health and wellbeing indicators.

These include datasets on the number of children living below the poverty line, the number of households spending more than 30 percent of their income on housing, and the proportion of adults who have a sense of community belonging. As well as the most recent data for each indicator, the dashboard includes target figures and the current status of the city’s progress towards that goal…

The launch represents the first phase of the project and there are plans to expand the dashboard to include additional indicators, as well as neighbourhood-level and disaggregated data for different populations. The city is also working with Indigenous communities to identify more decolonised ways of collecting and analysing the data.

report published last year by British Columbia’s Office of the Human Rights Commissioner called for provincial governments to collect and use disaggregated demographic and race-based data to address systemic racism and inequities. It emphasised that the process must include the community.

“One important piece that we’re still working on is data governance,” Zak said. “As we publish more disaggregated data that shows which communities in Vancouver are most impacted by health inequities, we need to do it in a way that is not just the local government telling stories about a community, but instead is telling a story with the community that leads to policy change.”…

Technical and financial support for the dashboard was provided by the Partnership for Healthy Cities, a global network of cities for preventing noncommunicable diseases and injuries. The partnership is supported by Bloomberg Philanthropies in partnership with the World Health Organization and the public health organisation Vital Strategies….(More)”.

Administrative Law in the Automated State


Paper by Cary Coglianese: “In the future, administrative agencies will rely increasingly on digital automation powered by machine learning algorithms. Can U.S. administrative law accommodate such a future? Not only might a highly automated state readily meet longstanding administrative law principles, but the responsible use of machine learning algorithms might perform even better than the status quo in terms of fulfilling administrative law’s core values of expert decision-making and democratic accountability. Algorithmic governance clearly promises more accurate, data-driven decisions. Moreover, due to their mathematical properties, algorithms might well prove to be more faithful agents of democratic institutions. Yet even if an automated state were smarter and more accountable, it might risk being less empathic. Although the degree of empathy in existing human-driven bureaucracies should not be overstated, a large-scale shift to government by algorithm will pose a new challenge for administrative law: ensuring that an automated state is also an empathic one….(More)”.

Control Creep: When the Data Always Travels, So Do the Harms


Essay by Sun-ha Hong: “In 2014, a Canadian firm made history. Calgary-based McLeod Law brought the first known case in which Fitbit data would be used to support a legal claim. The device’s loyalty was clear: the young woman’s personal injury claim would be supported by her own Fitbit data, which would help prove that her activity levels had dipped post-injury. Yet the case had opened up a wider horizon for data use, both for and against the owners of such devices. Leading artificial intelligence (AI) researcher Kate Crawford noted at the time that the machines we use for “self-tracking” may be opening up a “new age of quantified self incrimination.”

Subsequent cases have demonstrated some of those possibilities. In 2015, a Connecticut man reported that his wife had been murdered by a masked intruder. Based partly on the victim’s Fitbit data, and other devices such as the family house alarm, detectives charged the man — not a masked intruder — with the crime. “In 2016, a Pennsylvania woman claimed she was sexually assaulted, but police argued that the woman’s own Fitbit data suggested otherwise, and charged her with false reporting.” In the courts and elsewhere, data initially gathered for self-tracking is increasingly being used to contradict or overrule the self — despite academic research and even a class action lawsuit alleging high rates of error in Fitbit data.

The data always travels, creating new possibilities for judging and predicting human lives. We might call it control creep: data-driven technologies tend to be pitched for a particular context and purpose, but quickly expand into new forms of control. Although we often think about data use in terms of trade-offs or bargains, such frameworks can be deeply misleading. What does it mean to “trade” personal data for the convenience of, say, an Amazon Echo, when the other side of that trade is constantly arranging new ways to sell and use that data in ways we cannot anticipate? As technology scholars Jake Goldenfein, Ben Green and Salomé Viljoen argue, the familiar trade-off of “privacy vs. X” rarely results in full respect for both values but instead tends to normalize a further stripping of privacy….(More)”.

Data Brokers Are a Threat to Democracy


Justin Sherman at Wired: “Enter the data brokerage industry, the multibillion dollar economy of selling consumers’ and citizens’ intimate details. Much of the privacy discourse has rightly pointed fingers at Facebook, Twitter, YouTube, and TikTok, which collect users’ information directly. But a far broader ecosystem of buying up, licensing, selling, and sharing data exists around those platforms. Data brokerage firms are middlemen of surveillance capitalism—purchasing, aggregating, and repackaging data from a variety of other companies, all with the aim of selling or further distributing it.

Data brokerage is a threat to democracy. Without robust national privacy safeguards, entire databases of citizen information are ready for purchase, whether to predatory loan companies, law enforcement agencies, or even malicious foreign actors. Federal privacy bills that don’t give sufficient attention to data brokerage will therefore fail to tackle an enormous portion of the data surveillance economy, and will leave civil rights, national security, and public-private boundaries vulnerable in the process.

Large data brokers—like Acxiom, CoreLogic, and Epsilon—tout the detail of their data on millions or even billions of people. CoreLogic, for instance, advertises its real estate and property information on 99.9 percent of the US population. Acxiom promotes 11,000-plus “data attributes,” from auto loan information to travel preferences, on 2.5 billion people (all to help brands connect with people “ethically,” it adds). This level of data collection and aggregation enables remarkably specific profiling.

Need to run ads targeting poor families in rural areas? Check out one data broker’s “Rural and Barely Making It” data set. Or how about racially profiling financial vulnerability? Buy another company’s “Ethnic Second-City Strugglers” data set. These are just some of the disturbing titles captured in a 2013 Senate report on the industry’s data products, which have only expanded since. Many other brokers advertise their ability to identify subgroups upon subgroups of individuals through criteria like race, gender, marital status, and income level, all sensitive characteristics that citizens likely didn’t know would end up in a database—let alone up for sale….(More)”.

Undoing Optimization: Civic Action in Smart Cities


Book by Alison B. Powell: “City life has been reconfigured by our use—and our expectations—of communication, data, and sensing technologies. This book examines the civic use, regulation, and politics of these technologies, looking at how governments, planners, citizens, and activists expect them to enhance life in the city. Alison Powell argues that the de facto forms of citizenship that emerge in relation to these technologies represent sites of contention over how governance and civic power should operate. These become more significant in an increasingly urbanized and polarized world facing new struggles over local participation and engagement. The author moves past the usual discussion of top-down versus bottom-up civic action and instead explains how citizenship shifts in response to technological change and particularly in response to issues related to pervasive sensing, big data, and surveillance in “smart cities.”…(More)”.

Advancing data literacy in the post-pandemic world


Paper by Archita Misra (PARIS21): “The COVID-19 crisis presents a monumental opportunity to engender a widespread data culture in our societies. Since early 2020, the emergence of popular data sites like Worldometer2 have promoted interest and attention in data-driven tracking of the pandemic. “R values”, “flattening the curve” and “exponential increase” have seeped into everyday lexicon. Social media and news outlets have filled the public consciousness with trends, rankings and graphs throughout multiple waves of COVID-19.

Yet, the crisis also reveals a critical lack of data literacy amongst citizens in many parts of the world. The lack of a data literate culture predates the pandemic. The supply of statistics and information has significantly outpaced the ability of lay citizens to make informed choices about their lives in the digital data age.

Today’s fragmented datafied information landscape is also susceptible to the pitfalls of misinformation, post-truth politics and societal polarisation – all of which demand a critical thinking lens towards data. There is an urgent need to develop data literacy at the level of citizens, organisations and society – such that all actors are empowered to navigate the complexity of modern data ecosystems.

The paper identifies three key take-aways. It is crucial to

  • forge a common language around data literacy
  • adopt a demand-driven approach and participatory approach to doing data literacy
  • move from ad-hoc programming towards sustained policy, investment and impact…(More)”.

Socially Responsible Data Labeling


Blog By Hamed Alemohammad at Radiant Earth Foundation: “Labeling satellite imagery is the process of applying tags to scenes to provide context or confirm information. These labeled training datasets form the basis for machine learning (ML) algorithms. The labeling undertaking (in many cases) requires humans to meticulously and manually assign captions to the data, allowing the model to learn patterns and estimate them for other observations.

For a wide range of Earth observation applications, training data labels can be generated by annotating satellite imagery. Images can be classified to identify the entire image as a class (e.g., water body) or for specific objects within the satellite image. However, annotation tasks can only identify features observable in the imagery. For example, with Sentinel-2 imagery at the 10-meter spatial resolution, one cannot detect the more detailed features of interest, such as crop types but would be able to distinguish large croplands from other land cover classes.

Human error in labeling is inevitable and results in uncertainties and errors in the final label. As a result, it’s best practice to examine images multiple times and then assign a majority or consensus label. In general, significant human resources and financial investment is needed to annotate imagery at large scales.

In 2018, we identified the need for a geographically diverse land cover classification training dataset that required human annotation and validation of labels. We proposed to Schmidt Futures a project to generate such a dataset to advance land cover classification globally. In this blog post, we discuss what we’ve learned developing LandCoverNet, including the keys to generating good quality labels in a socially responsible manner….(More)”.

How we mapped billions of trees in West Africa using satellites, supercomputers and AI


Martin Brandt and Kjeld Rasmussen in The Conversation: “The possibility that vegetation cover in semi-arid and arid areas was retreating has long been an issue of international concern. In the 1930s it was first theorized that the Sahara was expanding and woody vegetation was on the retreat. In the 1970s, spurred by the “Sahel drought”, focus was on the threat of “desertification”, caused by human overuse and/or climate change. In recent decades, the potential impact of climate change on the vegetation has been the main concern, along with the feedback of vegetation on the climate, associated with the role of the vegetation in the global carbon cycle.

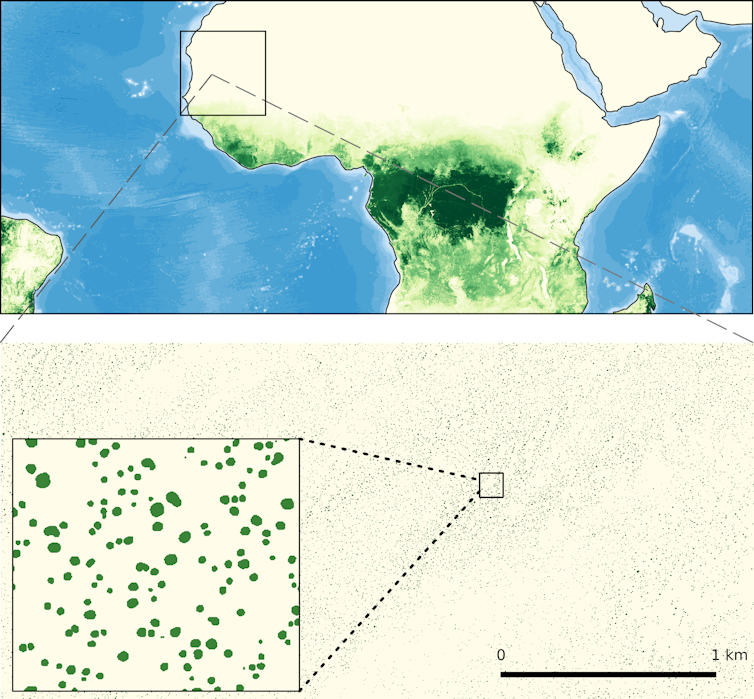
Using high-resolution satellite data and machine-learning techniques at supercomputing facilities, we have now been able to map billions of individual trees and shrubs in West Africa. The goal is to better understand the real state of vegetation coverage and evolution in arid and semi-arid areas.

Finding a shrub in the desert – from space

Since the 1970s, satellite data have been used extensively to map and monitor vegetation in semi-arid areas worldwide. Images are available in “high” spatial resolution (with NASA’s satellites Landsat MSS and TM, and ESA’s satellites Spot and Sentinel) and “medium or low” spatial resolution (NOAA AVHRR and MODIS).

To accurately analyse vegetation cover at continental or global scale, it is necessary to use the highest-resolution images available – with a resolution of 1 metre or less – and up until now the costs of acquiring and analysing the data have been prohibitive. Consequently, most studies have relied on moderate- to low-resolution data. This has not allowed for the identification of individual trees, and therefore these studies only yield aggregate estimates of vegetation cover and productivity, mixing herbaceous and woody vegetation.

In a new study covering a large part of the semi-arid Sahara-Sahel-Sudanian zone of West Africa, published in Nature in October 2020, an international group of researchers was able to overcome these limitations. By combining an immense amount of high-resolution satellite data, advanced computing capacities, machine-learning techniques and extensive field data gathered over decades, we were able to identify individual trees and shrubs with a crown area of more than 3 m2 with great accuracy. The result is a database of 1.8 billion trees in the region studied, available to all interested….(More)”

Supercomputing, machine learning, satellite data and field assessments allow to map billions of individual trees in West Africa. Martin Brandt, Author provided